
Activity diagrams are a cornerstone of system modeling. They describe the flow of control and data from one activity to another within a system. Whether you are designing a software application, mapping a business process, or defining a workflow for a team, understanding how to construct these diagrams is vital. This guide addresses the most frequent questions regarding the creation, structure, and application of activity diagrams.
By the end of this resource, you will have a clear understanding of the symbols, the logic, and the best practices required to produce diagrams that communicate complex behaviors effectively without ambiguity.
❓ What exactly is an Activity Diagram? 🤔
An activity diagram is a graphical representation of the dynamic behavior of a system. Unlike static diagrams that show structure (like class diagrams), activity diagrams show how actions happen over time. They focus on the flow of activities, decision points, and the transitions between them.
- Core Function: It illustrates the workflow of a process.
- Scope: It can range from high-level business processes to detailed algorithmic steps.
- Visualization: It uses nodes and edges to map the path of execution.
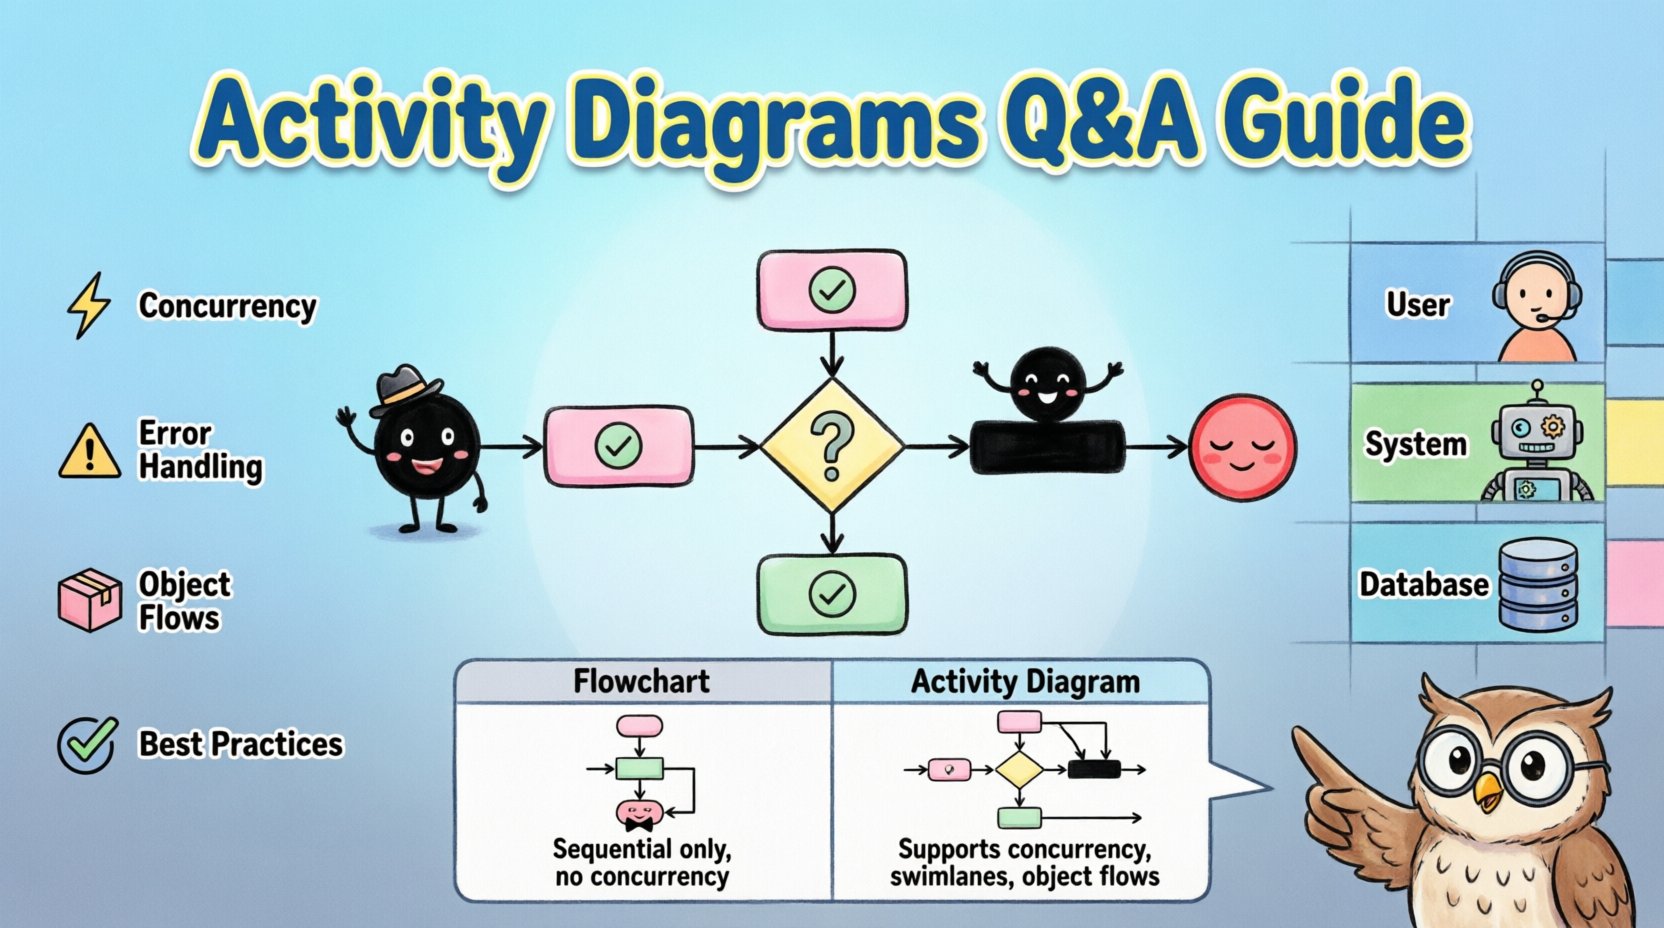
Think of it as a specialized flowchart. While similar in appearance, activity diagrams include specific notations for concurrency, object flows, and swimlanes that standard flowcharts often lack. They are integral to the Unified Modeling Language (UML) standard.
❓ When should you use an Activity Diagram? 📅
Not every process requires an activity diagram. You should utilize them when the complexity of the process exceeds what a simple list can convey. Consider using them in the following scenarios:
- Complex Workflows: When a process involves multiple decision points and branches.
- Concurrency: When tasks happen simultaneously and need to synchronize.
- Multi-Role Processes: When different actors or system components interact within the same workflow.
- Algorithmic Logic: When defining the logic for a specific function or method.
- Business Process Re-engineering: When analyzing and optimizing existing business operations.
Using an activity diagram when the process is linear and simple may introduce unnecessary complexity. However, as the number of steps and branching paths grows, these diagrams become essential for clarity.
❓ What are the fundamental symbols and nodes? 🔑
Understanding the vocabulary of activity diagrams is the first step to creating them. The notation is standardized, ensuring that anyone familiar with the system can read the diagram.
1. Initial Node (Start Point) ⚫
This is a solid filled circle. It marks the beginning of the flow. There should typically be only one initial node per diagram to establish a clear entry point.
2. Activity Node (Action) 🔲
These are rounded rectangles. They represent a task or a period of activity. This is the most common element. It can represent a single operation or a complex sub-process.
3. Decision Node (Branching) ⬛
A diamond shape. It represents a point where the flow splits based on a condition. Each outgoing path must have a guard condition (a boolean expression) that determines which path is taken.
4. Merge Node (Joining Paths) ⬜
Also a diamond, but it represents the merging of multiple control flows into a single flow. It does not make decisions; it simply collects paths.
5. Fork and Join Nodes (Concurrency) ⚙️
These are thick horizontal or vertical bars.
- Fork: Splits one flow into multiple concurrent flows.
- Join: Waits for all incoming concurrent flows to complete before continuing the single flow.
6. Final Node (End Point) 🔴
A solid circle with a border. It marks the termination of the activity. A diagram can have multiple final nodes to indicate different outcomes (success, failure, timeout).
❓ How do Swimlanes improve the diagram? 🏊
Swimlanes (or partitions) are used to organize activities by responsibility. They visually separate the diagram into lanes, where each lane represents a specific actor, role, or system component.
Benefits of Swimlanes:
- Clarity of Responsibility: It is immediately obvious which actor performs which action.
- Process Ownership: It helps identify handoffs between departments or systems.
- Reduced Complexity: By grouping related activities, the overall layout becomes more structured.
- Identification of Bottlenecks: It becomes easier to see where work piles up within a specific lane.
Without swimlanes, a complex diagram can become a “spaghetti chart” where arrows cross randomly. Swimlanes impose order and hierarchy on the visual layout.
❓ How do you handle Concurrency and Parallelism? ⚡
Real-world processes rarely happen in a strictly linear sequence. Multiple tasks often occur at the same time. Activity diagrams handle this using Fork and Join nodes.
- Identify Parallel Tasks: Look for steps that can occur simultaneously without interfering with each other.
- Insert a Fork: Place a fork node after the common activity. This splits the control flow into parallel paths.
- Define Parallel Activities: Draw the activities that run concurrently in separate branches.
- Insert a Join: Place a join node where the parallel branches must synchronize. The flow cannot continue until all incoming branches are complete.
Note: Ensure that your join node matches the fork. If you fork into three paths, you must join all three paths before proceeding.
❓ What is the difference between an Activity Diagram and a Flowchart? 🔄
While they look similar, they serve different modeling purposes. A flowchart is a general tool for mapping logic, often used in programming or simple business processes. An activity diagram is a specific UML notation designed for software modeling and system analysis.
| Feature | Flowchart | Activity Diagram |
|---|---|---|
| Standard | Varies by tool/industry | UML Standardized |
| Concurrency | Difficult to represent | Native support (Fork/Join) |
| Swimlanes | Optional | Core feature (Partitions) |
| Context | General Process | Software/System Behavior |
| Object Flows | Not standard | Can represent data movement |
This distinction is important when collaborating with software engineering teams. Using UML-compliant activity diagrams ensures compatibility with other modeling artifacts.
❓ How do you manage Exceptions and Errors? ⚠️
Standard flows describe the happy path. However, systems must handle failures. Activity diagrams support exception handling through specific mechanisms.
- Exception Nodes: You can explicitly model an activity that handles an error. If an exception occurs, control transfers to this node.
- Guard Conditions: Use guards on decision nodes to route to error-handling paths (e.g., if “Validation Fails”, go to “Error Handling”).
- Separate Final Nodes: Use different final nodes for success and failure states to clearly terminate the flow based on the outcome.
Do not ignore error states in your diagrams. A complete model accounts for what happens when things go wrong, not just when they go right.
❓ What are Object Flows and how do they work? 📦
Control flow shows the order of actions. Object flow shows the movement of data or objects between activities. In an activity diagram, objects are represented as rectangular boxes with lines connecting them to activity nodes.
Example: An activity “Calculate Total” might produce an “Invoice” object. This object then flows into an activity “Send Invoice”.
- Input Object: An object entering an activity node.
- Output Object: An object produced by an activity node.
- Object Nodes: Represent a collection of objects existing at a specific point in the process.
Integrating object flows with control flows provides a complete picture of the system’s behavior, showing not just what happens, but what data is involved.
❓ How do you determine the right level of granularity? 🔍
One of the most common challenges is deciding how detailed to make the diagram. If it is too high-level, it lacks utility. If it is too detailed, it becomes unreadable.
Strategies for Granularity:
- High-Level: Focus on major business phases. Use this for stakeholder communication and project scope.
- Mid-Level: Focus on specific use cases. Use this for analysis and design phases.
- Low-Level: Focus on specific method logic. Use this for implementation guidance.
A good rule of thumb is to create a hierarchy. Start with a high-level overview. If a specific activity becomes too complex to understand, decompose it into a separate, more detailed activity diagram. This keeps each diagram manageable.
❓ What are common mistakes to avoid? 🚫
Even experienced modelers make errors. Being aware of common pitfalls can save significant time during review.
- Dead Ends: Ensure every path leads to a final node. A flow that stops unexpectedly is a design flaw.
- Circular Loops without Exit: Loops must have a clear condition to terminate. Infinite loops confuse the logic.
- Overcrowded Swimlanes: If a lane contains too many activities, split the diagram or move some activities to a different lane if possible.
- Unclear Guard Conditions: Decision nodes must have labels explaining the condition (e.g., “Yes/No”, “True/False”).
- Ignoring Concurrency: If tasks happen at the same time, do not force them into a sequential line. Use Fork/Join nodes.
- Too Many Crossings: Try to arrange the diagram so arrows do not cross unnecessarily. Use orthogonality (right angles) for lines.
❓ How do Activity Diagrams integrate with other UML Diagrams? 🧩
Activity diagrams do not exist in isolation. They work alongside other diagrams to provide a complete system view.
- Use Case Diagrams: Activity diagrams can be used to flesh out the details of a specific use case.
- Sequence Diagrams: Sequence diagrams show interactions between objects over time. Activity diagrams show the workflow logic. They often complement each other.
- Class Diagrams: The objects moved in an activity diagram should match the classes defined in the class diagram.
- State Machine Diagrams: Both describe behavior. State machines focus on states triggered by events, while activity diagrams focus on actions and control flow.
Consistency across these diagrams is crucial. If an activity diagram references a class that does not exist in the class diagram, the model is incomplete.
❓ What are the best practices for readability? 📝
A diagram that no one can read is useless. Follow these guidelines to ensure clarity.
Layout and Spacing
- Top-Down or Left-Right: Maintain a consistent direction for the flow.
- Adequate Spacing: Do not crowd nodes. Leave room for labels and guard conditions.
- Orthogonal Lines: Draw lines using only horizontal and vertical segments. Avoid diagonal lines.
Labels and Text
- Active Voice: Label activities with verbs (e.g., “Validate User” instead of “User Validation”).
- Consistent Naming: Use the same terminology for the same concepts throughout the diagram.
- Minimal Text: Keep labels concise. Move detailed descriptions to notes or documentation.
Navigation
- Hyperlinks: If using digital tools, link to related diagrams or documentation.
- Page Numbers: For long diagrams, number the pages or sections clearly.
❓ How do you validate the logic of an activity diagram? ✅
Once the diagram is drawn, you must verify it. Walkthroughs are the standard method for validation.
- Trace the Flow: Start at the initial node and follow every possible path to a final node.
- Check Conditions: Verify that guard conditions cover all possibilities (e.g., True and False).
- Verify Concurrency: Ensure all forked paths eventually join.
- Review with Stakeholders: Have domain experts review the diagram to ensure it matches real-world processes.
- Check for Redundancy: Look for activities that do not change the state or outcome.
Validation is an iterative process. It is normal to revise the diagram multiple times before it is finalized.
❓ Can activity diagrams represent data transformations? 🔄
Yes, but with a distinction. While they focus on control flow, they can imply data transformation through object flows. An activity transforms an input object into an output object.
Example:
- Input: “Raw Data”
- Activity: “Process Data”
- Output: “Processed Data”
For complex data manipulation, it is often better to pair the activity diagram with a data dictionary or a class diagram that defines the data structures explicitly. The activity diagram focuses on the action, not the data schema.
❓ How do you document the diagram effectively? 📂
Documentation accompanies the visual representation. It provides context that the diagram cannot hold.
- Legend: Define any non-standard symbols if you must use them.
- Scope: State what is included and what is excluded from the diagram.
- Prerequisites: List any conditions that must be met before the process starts.
- Post-conditions: Define the state of the system when the process ends.
- References: Link to related requirements or specifications.
Proper documentation ensures that the diagram remains useful long after it is created, allowing new team members to understand the system without confusion.
❓ What is the relationship between activity diagrams and business rules? ⚖️
Business rules are constraints or conditions that govern the behavior of the system. Activity diagrams are the ideal place to visualize these rules.
- Guard Conditions: These are the primary way to embed business rules into the flow (e.g., “if Balance > 0”).
- Swimlanes: Swimlanes often represent the roles responsible for enforcing specific rules.
- Decision Nodes: These nodes explicitly model branching logic based on business constraints.
When creating these diagrams, ensure that every business rule has a corresponding visual element. If a rule is not depicted, it may be overlooked during implementation.
❓ How do you handle loops in the diagram? 🔁
Loops are common in processes. They are represented by control flows that return to a previous node. However, they must be controlled.
- Iterative Loops: Use a decision node to check a condition before repeating (e.g., “Continue? Yes/No”).
- Recursive Actions: If an activity calls itself, represent it as a separate sub-diagram to avoid circular confusion.
- Timeouts: For processes that might hang, add a timeout path that leads to an exception or termination node.
Always ensure that a loop has a clear exit condition. Infinite loops indicate a logical error in the design.
❓ Summary of Key Takeaways 🎯
Creating effective activity diagrams requires a balance of technical precision and visual clarity. They are powerful tools for modeling dynamic behavior, concurrency, and complex workflows.
- Use Swimlanes: To clarify responsibility and reduce complexity.
- Standardize Symbols: Follow UML standards for Fork, Join, and Decision nodes.
- Focus on Flow: Ensure every path leads to a clear outcome.
- Validate Logic: Walk through the diagram to find dead ends or loops.
- Maintain Granularity: Break complex processes into manageable sub-diagrams.
By adhering to these principles, you can produce diagrams that serve as reliable blueprints for system development and business analysis. The effort invested in creating clear models pays off significantly during the implementation and testing phases.