
Activity diagrams are a critical component of the Unified Modeling Language (UML) ecosystem. They serve as the primary method for visualizing the dynamic behavior of a system. Unlike static structure diagrams that define what a system is, activity diagrams define how a system behaves over time. They map out the sequence of actions, the flow of control, and the logic governing transitions between states.
This guide explores the mechanics of constructing these diagrams. We will examine the fundamental shapes, the logic behind control flows, and advanced techniques for handling concurrency and complex business processes. By understanding these elements, you can create precise models that bridge the gap between abstract requirements and concrete implementation.
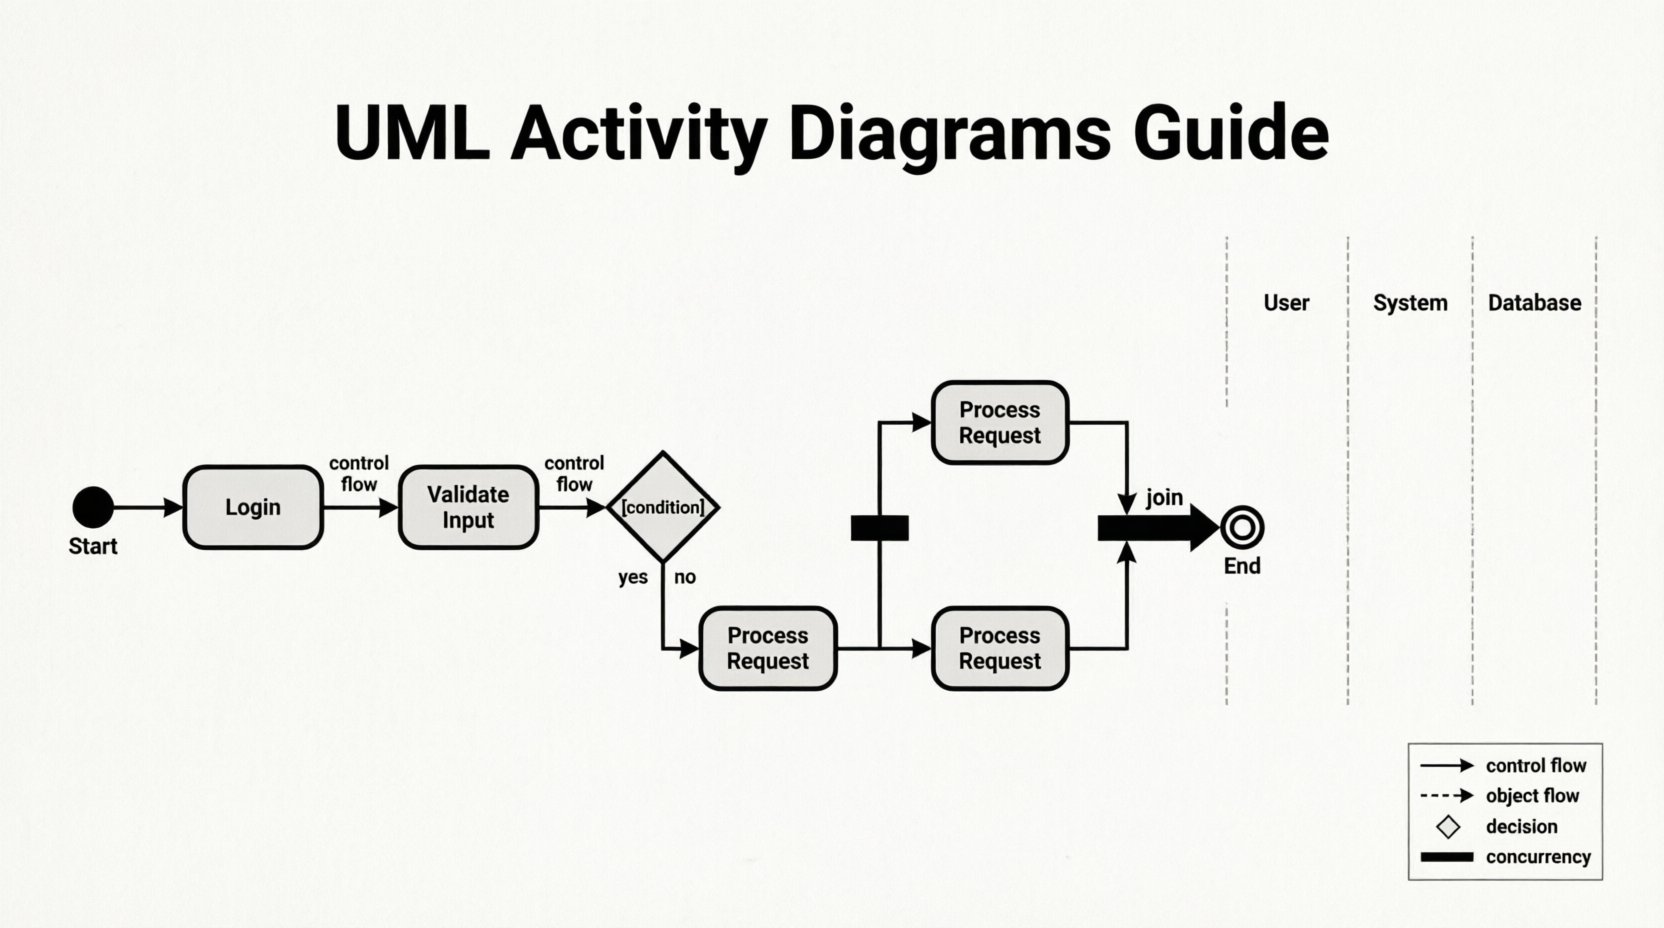
Understanding the Core Components 🧩
Every activity diagram is built from a specific set of graphical elements. Each element carries a distinct semantic meaning. Using the correct shape ensures that the model is unambiguous to stakeholders and developers.
1. Initial Node
- Symbol: A solid filled circle.
- Purpose: Marks the starting point of the activity.
- Constraint: There should typically be only one initial node per diagram to define a clear entry point.
2. Activity Final Node
- Symbol: A solid filled circle inside a larger circle.
- Purpose: Indicates the normal termination of the entire activity.
- Behavior: When control reaches this node, the activity ends, and no further actions occur within this specific flow.
3. Flow Final Node
- Symbol: A circle with a cross inside.
- Purpose: Signals the termination of a specific flow only.
- Usage: Useful when one branch of a process ends without stopping the entire system. This allows other parallel flows to continue.
4. Decision Node
- Symbol: A diamond shape.
- Purpose: Directs the flow based on a condition.
- Output: Multiple outgoing edges, each labeled with a guard condition (e.g.,
trueorfalse).
5. Merge Node
- Symbol: A diamond shape (similar to decision but without logic).
- Purpose: Combines multiple incoming flows into a single outgoing flow.
- Context: Used after decision nodes to reunite paths that diverged due to conditions.
Controlling the Flow and Logic 🔄
Activity diagrams are not just drawings; they represent executable logic. The way control moves between nodes determines the behavior of the modeled process. Understanding guards and object flows is essential for accuracy.
Guard Conditions
Guard conditions are boolean expressions that determine which path control takes through a decision node. They are placed on the outgoing edges.
- Syntax: Usually written in square brackets, such as
[payment confirmed]. - Requirement: The sum of all guard conditions leaving a decision node should ideally cover all possible scenarios to avoid deadlocks.
- Default: If no specific condition is met, control may follow a default path, often labeled
[else].
Object Flows
While control flows represent the sequence of actions, object flows represent the movement of data or objects. This distinction is vital for understanding data transformation.
- Control Flow: Thin solid line with an arrow. Indicates execution order.
- Object Flow: Dashed line with an arrow. Indicates data movement.
- Object Nodes: Rectangles with the name of the data type. They act as temporary storage or buffers between actions.
Swimlanes and Partitioning 🏊
As processes grow in complexity, a single list of actions becomes difficult to read. Swimlanes provide a way to organize activities based on responsibility. This concept is often referred to as partitioning.
Types of Swimlanes
- Organizational Swimlanes: Group activities by department or role (e.g., HR, Engineering, Customer Support).
- System Swimlanes: Group activities by system component (e.g., Frontend, Backend API, Database).
- Process Swimlanes: Group activities by stage in the lifecycle (e.g., Planning, Development, Testing).
Benefits of Partitioning
- Clarity: Immediately shows who is responsible for each step.
- Handoff Visibility: Makes it easy to identify where work transfers between teams or systems.
- Parallelism: Helps visualize which parts of the process can happen simultaneously across different lanes.
Advanced Control Flows ⚙️
Basic sequential flows are often insufficient for real-world scenarios. Advanced activity diagrams handle concurrency, interruptions, and complex branching.
Fork and Join
Concurrency allows multiple activities to occur at the same time. This is managed using fork and join nodes.
- Fork Node: A thick horizontal bar. It splits a single incoming flow into multiple outgoing flows. Control passes to all outgoing paths simultaneously.
- Join Node: A thick horizontal bar. It merges multiple incoming flows into a single outgoing flow. Control waits for all incoming flows to arrive before proceeding.
Interruptible Activity Regions
Some processes are subject to external events that require immediate attention. Interruptible regions allow an activity to be paused or stopped by a specific event.
- Structure: Enclosed in a bordered rectangle labeled Interruptible Region.
- Trigger: An activity inside the region can be interrupted by an event (e.g., Timeout, Error).
- Exit: If the interrupt event occurs, the current flow exits the region and moves to a handler, bypassing the remaining steps.
Exception Handling
Robust processes account for failure. Activity diagrams can explicitly model error handling paths.
- Decision Nodes: Check for error states after an action completes.
- Retry Loops: Control flow can return to a previous node to attempt an action again if a failure occurs.
- Alternative Paths: If a primary action fails, the flow diverts to a recovery procedure.
Comparison with Other UML Diagrams 📋
Selecting the right diagram type is crucial for effective communication. Below is a comparison of activity diagrams against other common behavioral diagrams.
| Diagram Type | Primary Focus | Best Used For |
|---|---|---|
| Activity Diagram | Workflow and logic flow | Business processes, algorithms, multi-threaded logic |
| Sequence Diagram | Interaction between objects | API calls, message timing, object relationships |
| State Machine Diagram | State changes of an object | Device states, user session states, lifecycle management |
| Use Case Diagram | Functional requirements | High-level system scope, actor interactions |
Best Practices for Modeling ✅
Creating an effective activity diagram requires adherence to specific guidelines. These practices ensure the model remains readable and useful throughout the development lifecycle.
1. Maintain Consistency
- Use standard UML notation for all shapes.
- Keep the notation style uniform across all diagrams in the project.
- Avoid mixing abstract and concrete representations in the same diagram.
2. Limit Scope
- Do not attempt to model the entire system in one diagram.
- Break complex processes into sub-diagrams.
- Use Call Behavior Actions to reference other activity diagrams for high-level views.
3. Balance Detail
- Too much detail obscures the main flow.
- Too little detail fails to capture necessary logic.
- Focus on the control flow; omit internal data calculations unless critical.
4. Validate Logic
- Ensure every path leads to a final node.
- Check for infinite loops or deadlocks.
- Verify that all decision nodes have defined conditions for all outcomes.
Common Pitfalls to Avoid ❌
Even experienced modelers can make mistakes that reduce the value of the diagram. Being aware of common errors helps maintain quality.
- Overlapping Swimlanes: Avoid placing activities in lanes that do not belong to the responsible party. This creates confusion about ownership.
- Crossing Lines: Try to arrange nodes so that control flow lines do not cross unnecessarily. This improves readability significantly.
- Ignoring Concurrency: If two actions happen simultaneously, a linear diagram misrepresents the reality. Use fork and join nodes to show parallelism.
- Missing Guards: If a decision node has multiple paths, every path must have a condition. Leaving one unlabeled implies a default that may not exist.
- Ignoring Data Flow: Sometimes the movement of data is as important as the sequence of actions. Ensure object flows are included when data transformation is complex.
Implementation Considerations 🛠️
Activity diagrams often serve as a blueprint for automated workflows. When translating a diagram into code or configuration, certain rules apply.
From Diagram to Code
- Actions: Each action node can map to a function or method.
- Decisions: Map to conditional statements (if/else).
- Forks: Map to asynchronous threads or background jobs.
- Joins: Map to wait operations or synchronization barriers.
From Diagram to Workflow Engine
- Workflow engines use similar concepts to manage business processes.
- Activity diagrams can be directly converted into BPMN (Business Process Model and Notation) in some contexts.
- Variables in object flows map to process variables in the engine.
Conclusion
Activity diagrams provide a powerful mechanism for defining system behavior. They bridge the gap between high-level requirements and low-level logic. By mastering the shapes, flows, and advanced constructs, you can create models that are both technically accurate and easy to understand. Focus on clarity, consistency, and logical completeness to ensure your diagrams serve as effective tools for design and communication.
Remember that a diagram is a communication tool first and a technical specification second. If the stakeholders cannot understand the flow, the technical correctness of the notation is secondary. Regular reviews and validation against actual system behavior ensure the model remains relevant throughout the project lifecycle.