
Creating a visual representation of a system’s workflow is a critical skill for analysts, developers, and business stakeholders. An Activity Diagram is one of the most powerful tools in the Unified Modeling Language (UML) toolkit. It allows you to map out the flow of control from start to finish, highlighting parallel processes, decision points, and the final outcomes of a system.
This guide provides a comprehensive walkthrough on how to construct your first Activity Diagram from scratch. You do not need to rely on expensive tools or complex documentation. By understanding the core symbols and logical structures, you can model complex behaviors within 20 minutes. We will focus on the semantics, the syntax, and the best practices required to create diagrams that are clear, accurate, and useful.
🧠 What is an Activity Diagram?
An Activity Diagram describes the dynamic nature of a system by modeling the flow of control from activity to activity. It is often used to model the business logic or the internal logic of a system. Unlike a flowchart, which focuses on the flow of data, an Activity Diagram emphasizes the flow of control and the execution of actions.
Key characteristics include:
Behavioral Modeling: It shows what happens, not just how data moves.
Concurrency: It can represent multiple actions happening at the same time.
Decision Making: It visualizes conditional logic and branching paths.
Process Flow: It serves as a bridge between high-level requirements and detailed code.
🛠️ Core Symbols and Notation
Before drawing, you must understand the vocabulary of the diagram. Every shape has a specific meaning. Using them incorrectly can lead to ambiguity. Below is a breakdown of the essential elements you will need.
Symbol | Name | Function |
|---|---|---|
🟢 (Filled Circle) | Initial Node | The starting point of the diagram. No incoming edges. |
⏹️ (Hollow Circle) | Final Node | The end of a flow. No outgoing edges. |
🟦 (Rounded Rectangle) | Activity Node | A period of processing or action. |
⬡ (Diamond) | Decision Node | A point where the flow branches based on a condition. |
⏸️ (Thick Bar) | Fork/Join Node | Splits flow into parallel paths or merges them back. |
📊 (Arrow) | Control Flow | Indicates the sequence of actions. |
📦 (Solid Line) | Object Flow | Shows data or objects moving between actions. |
📝 Preparing Your Model
Before you begin placing shapes on the canvas, you need to define the scope of your activity. A diagram that tries to show everything will become unreadable. Focus on a specific use case or process.
Follow these preparatory steps:
Define the Trigger: What event starts this process? Is it a user login? A scheduled task? This determines the Initial Node.
Identify the Goal: What is the desired outcome? This determines the Final Node.
List the Activities: Break the process down into discrete actions. For example, “Validate Input” is an action; “Process Data” is another.
Determine Decisions: Where can the path diverge? If a user enters an invalid password, the flow changes. Mark these points as Decision Nodes.
🏗️ Step-by-Step Construction
Now that you have the plan, let us build the diagram. We will proceed logically, ensuring each connection makes sense.
Step 1: Place the Initial Node
Start with a filled black circle. This represents the entry point. There should be only one Initial Node per diagram to ensure a clear starting state. Connect an arrow pointing away from it to the first activity.
Step 2: Add the First Activity
Draw a rounded rectangle. Label it with the first action, such as “Receive Request” or “Load Configuration.” Ensure the label is a verb phrase (e.g., “Check Inventory” rather than “Inventory”). This keeps the diagram active and clear.
Step 3: Connect Subsequent Actions
Draw arrows from the first activity to the next. The direction of the arrow indicates the flow of control. If the process is linear, simply chain the rectangles. If the process involves waiting, you might need a wait state, often represented by a specific activity node or a comment.
Step 4: Introduce Decision Logic
When a condition must be met, insert a diamond shape. Draw an arrow from the previous activity to the diamond. Then, draw arrows leaving the diamond. Each arrow must be labeled with a guard condition in square brackets, such as [Valid] or [Invalid].
Step 5: Handle Parallelism
If two actions can happen simultaneously, use a thick horizontal bar (Fork). Draw an arrow entering the bar, and multiple arrows leaving it. Later, use another thick bar (Join) to merge them back into a single flow. This signifies that the subsequent action waits for all parallel paths to complete.
Step 6: Define the Final State
End every path with a Final Node. If you have multiple branches (e.g., Success and Failure), ensure they all lead to a Final Node. This indicates the termination of the workflow.
⚙️ Advanced Notation Details
Understanding the deeper syntax ensures your model is robust. Here are specific nuances to consider when refining your diagram.
Guard Conditions
Guard conditions are boolean expressions that determine which path is taken at a Decision Node. They must be mutually exclusive. If you have two paths leaving a decision, one should be [True] and the other [False], or specific conditions like [Age > 18] and [Age < 18].
Object Flow vs. Control Flow
It is common to confuse these two. Control Flow dictates the order of execution. Object Flow represents the movement of data or artifacts. For example, an “Order” object might flow from “Create Order” to “Process Payment”. You can show this by adding a line with an open arrow and labeling it with the object name. This helps stakeholders understand what data is required at each stage.
Exception Handling
Real-world systems often encounter errors. You can represent this by having a Decision Node that checks for errors. If an error occurs, the flow moves to a “Handle Exception” activity. This activity might loop back to the start or terminate with a failure state. This makes your diagram resilient and realistic.
🌊 Understanding Swimlanes
Swimlanes are a method of organizing activities by responsibility. They are essentially rectangular regions that group activities under a specific actor, department, or system component.
Why Use Swimlanes?
Clarity: It is immediately obvious who is responsible for a task.
Handoffs: You can see where the process moves from one system to another.
Accountability: It helps identify bottlenecks in specific departments.
How to Implement Them
Draw a large rectangle across the diagram. Divide it into horizontal or vertical strips. Label each strip with the responsible entity (e.g., “Customer,” “Server,” “Database”).
Place the activities inside the strip belonging to the responsible entity. Connect arrows that cross the boundaries to represent the interaction between entities. Ensure that arrows do not cross swimlanes unnecessarily, as this creates visual clutter.
❌ Common Mistakes to Avoid
Even experienced modelers make errors. Reviewing these common pitfalls will help you maintain the quality of your diagram.
Dangling Arrows: Every arrow must have a source and a destination. An arrow ending in mid-air is a syntax error.
Circular Dependencies: Unless explicitly modeling a loop, avoid creating cycles that make it impossible to reach a Final Node. Infinite loops are valid in code but often indicate an error in a process model.
Too Many Nodes: If a single activity is too complex, break it down into a separate diagram. A single Activity Diagram should usually focus on one use case or sub-process.
Missing Guard Conditions: Every outgoing arrow from a Decision Node must have a label explaining the condition. An unlabeled decision node is confusing.
Ignoring Concurrency: If two actions happen at the same time, using sequential arrows is incorrect. Use Fork and Join nodes to represent true parallelism.
🔄 Activity Diagram vs. Flowchart vs. Sequence Diagram
It is important to know when to use an Activity Diagram versus other modeling tools. While they share similarities, their purposes differ.
Diagram Type | Primary Focus | Best Used For |
|---|---|---|
Activity Diagram | Control Flow & Logic | Business workflows, complex algorithms, concurrency. |
Flowchart | Process Steps | Simplified business processes, non-technical audiences. |
Sequence Diagram | Interaction Over Time | System communication, API calls, timing of messages. |
If your goal is to show how a user interacts with a system over time (e.g., Login -> API Call -> Response), a Sequence Diagram is better. If your goal is to show the logic inside a specific method (e.g., If X, then Y, else Z), an Activity Diagram is the correct choice.
✅ Validation Checklist
Before finalizing your model, run through this checklist to ensure accuracy and completeness.
☐ Does the diagram have exactly one Initial Node?
☐ Does every path lead to a Final Node?
☐ Are all Decision Node arrows labeled with guard conditions?
☐ Are Fork and Join nodes balanced (one in, multiple out; or multiple in, one out)?
☐ Are labels descriptive and verb-based?
☐ Is the flow logical and free of dead ends?
☐ Are swimlanes used correctly to assign responsibility?
☐ Is the diagram readable without excessive line crossings?
🔍 Real-World Application Example
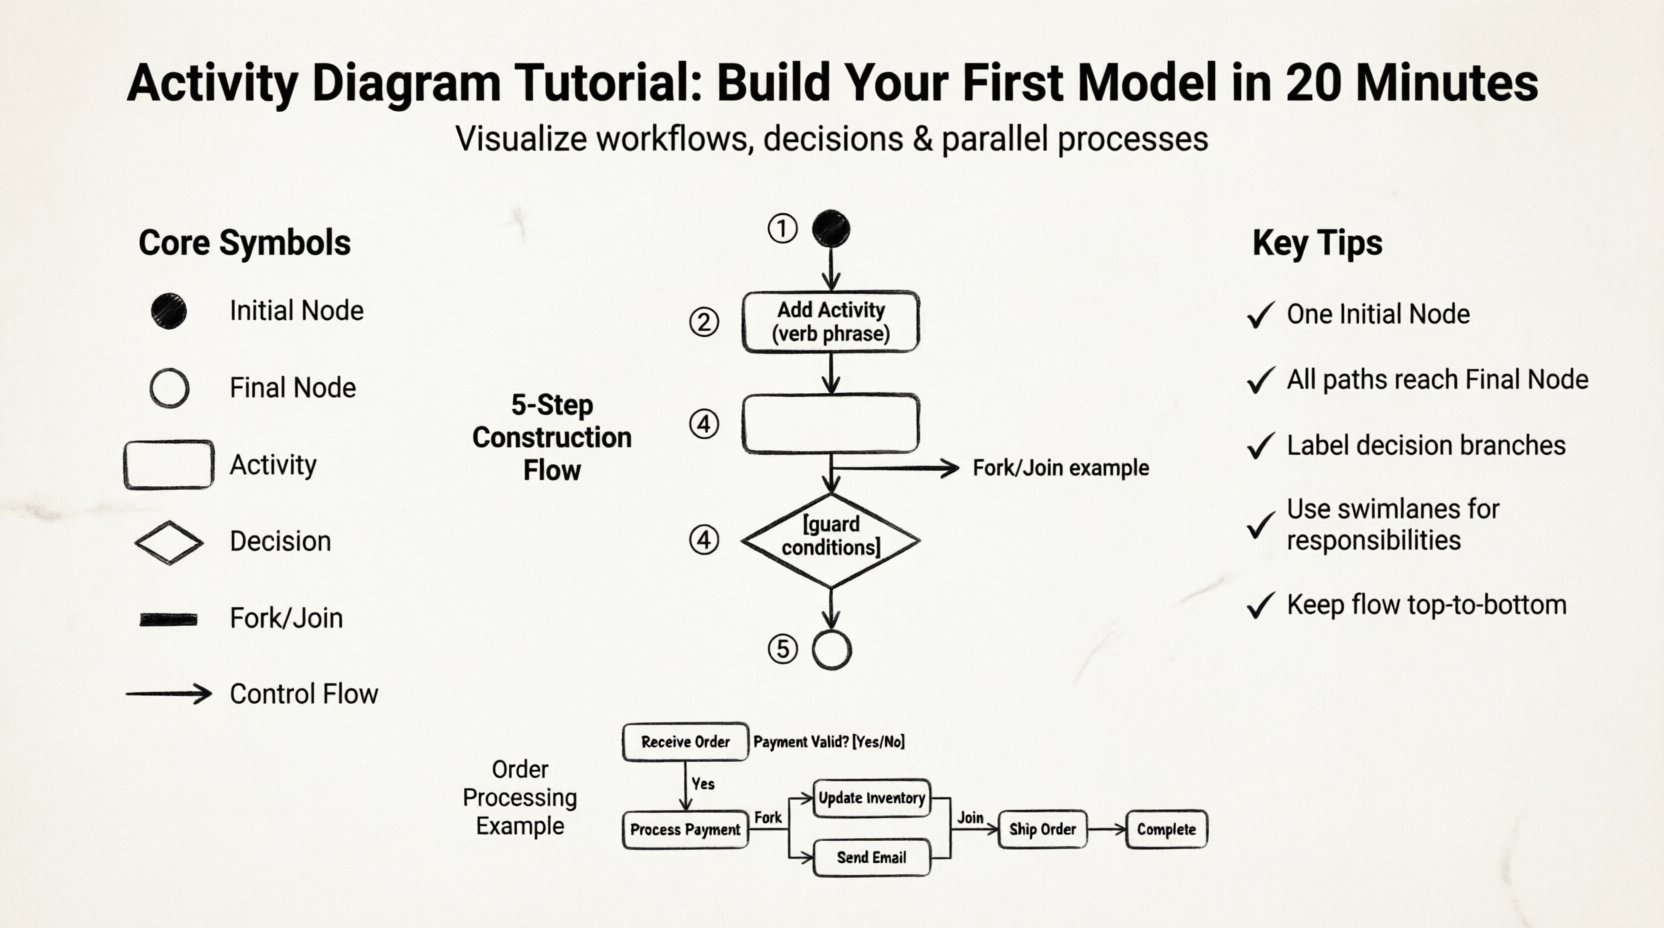
Consider a simple “Order Processing” workflow. This example demonstrates how the concepts combine.
Initial Node -> Receive Order
Receive Order -> Decision: Payment Valid?
Decision: If [No] -> Notify Customer -> End (Cancelled)
Decision: If [Yes] -> Process Payment -> Fork Node
Fork: Splits into two paths:
Path A: Update Inventory
Path B: Send Confirmation Email
Join Node: Merges Path A and Path B.
Join -> Ship Order -> Final Node (Completed)
This structure clearly shows that shipping cannot happen until both inventory and the email are handled. It also highlights the parallel nature of updating stock and notifying the user.
📈 Improving Diagram Readability
Even a logically correct diagram can be hard to read if the layout is poor. Apply these design principles to enhance clarity.
Directional Consistency: Keep the flow generally moving from top to bottom or left to right. Avoid arrows pointing backwards unless necessary for a loop.
Spacing: Leave enough white space between nodes. Crowded diagrams are difficult to parse.
Orthogonal Routing: Use right-angle bends for lines rather than diagonal or curved lines. This makes the path easier to follow.
Grouping: Use swimlanes or grouping boxes to cluster related activities together.
Consistent Labeling: Use the same font size and style for all labels. Bold key terms if necessary.
🏁 Summary of Workflow Creation
Building an Activity Diagram is a systematic process. It begins with understanding the trigger and the goal. You then map the sequence of actions, inserting decision points where logic changes. Parallel processes are handled with fork and join nodes, and responsibilities are assigned using swimlanes. By adhering to standard notation and avoiding common pitfalls, you create a document that serves as a single source of truth for the system’s behavior.
Remember that a diagram is a communication tool. Its value lies in how well it conveys information to your audience, whether they are technical developers or business managers. Practice creating diagrams for small tasks before tackling complex systems. With each iteration, your ability to visualize logic will improve, making you a more effective analyst and designer.
Start with the symbols, build the flow, and validate the logic. You now have the framework to model any process effectively.