
Understanding how software behaves is just as important as understanding how it looks. In the world of software engineering, visualizing processes is a critical skill. One of the most versatile tools for this purpose is the activity diagram. This guide provides a clear, technical look at activity diagrams, their components, and how they fit into the broader system design process.
🤔 What is an Activity Diagram?
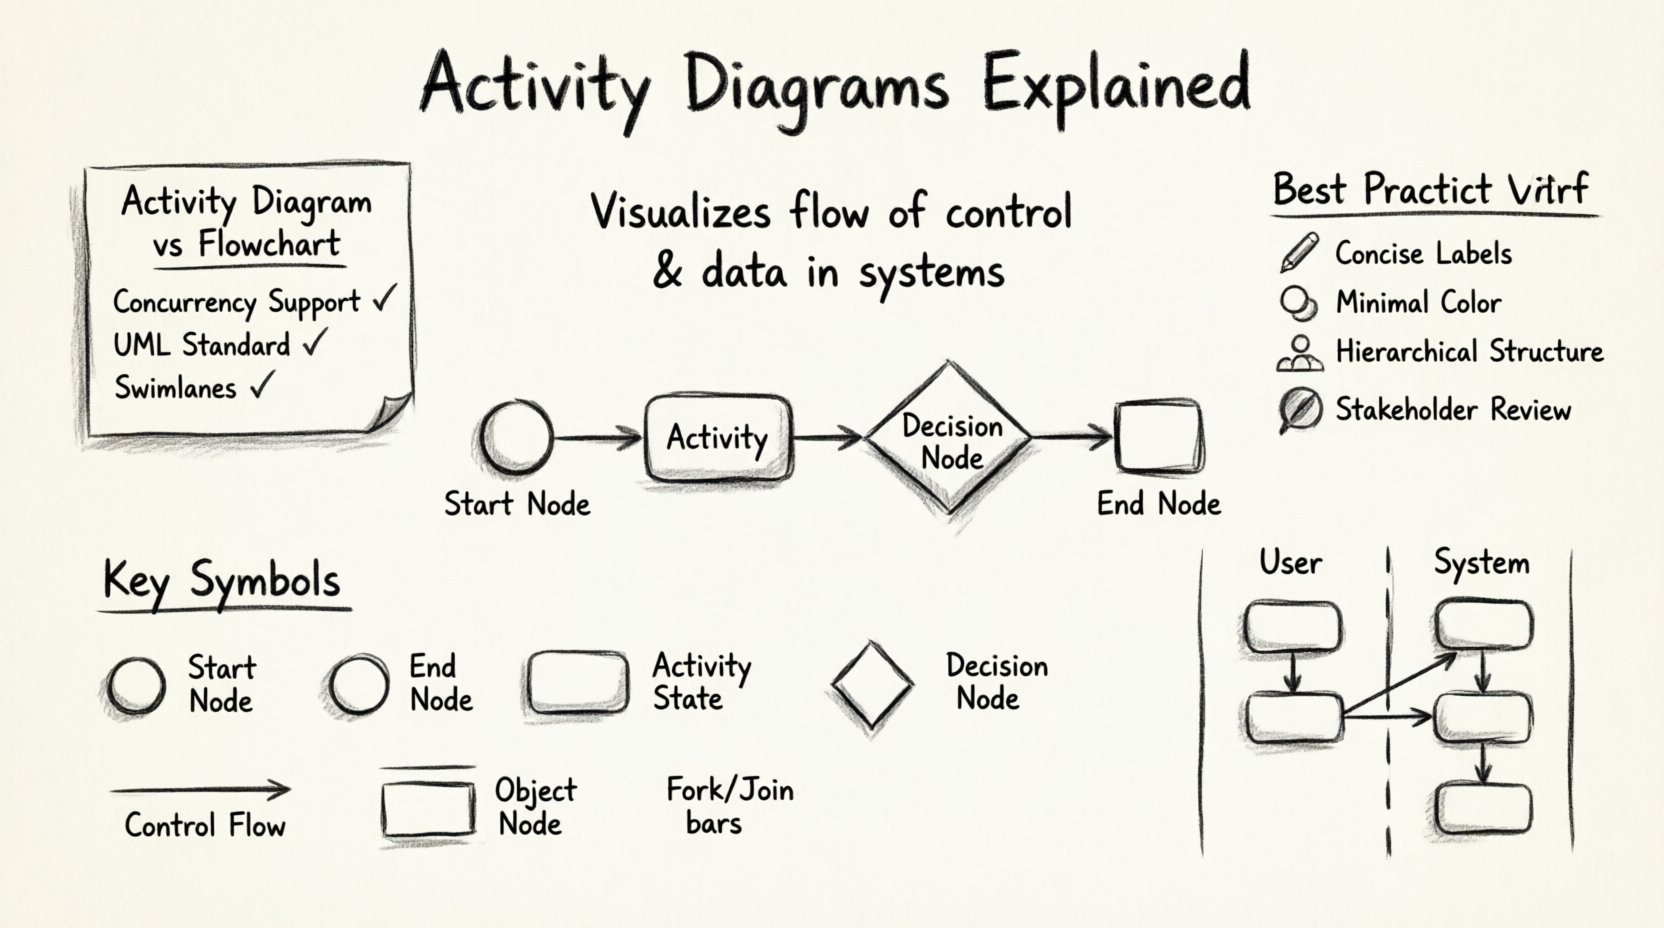
An activity diagram is a type of diagram used in Unified Modeling Language (UML) to represent the flow of control or data in a system. Think of it as a flowchart that specifically models the dynamic behavior of a system. It describes the sequence of actions, decisions, and parallel flows that occur during a specific process.
Unlike static diagrams that show structure, activity diagrams focus on behavior. They help teams visualize:
- How a system handles user inputs.
- How different components interact over time.
- The logic behind complex algorithms.
- Business workflows that the software supports.
By mapping out these steps, developers and stakeholders can identify bottlenecks, redundant steps, or logic errors before writing a single line of code. This proactive approach saves time and resources during the development lifecycle.
🛠️ Key Symbols and Notations
Activity diagrams rely on a standardized set of symbols. Knowing these symbols is the foundation of creating accurate diagrams. Below is a breakdown of the most common elements used in modeling.
| Symbol | Shape | Description |
|---|---|---|
| Start Node | ⚫ Filled Circle | Indicates the beginning of the activity flow. |
| End Node | ⚫ Circle with Border | Indicates the termination point of the activity. |
| Activity State | ⬜ Rounded Rectangle | Represents a task or process being performed. |
| Decision Node | ⬛ Diamond | Represents a branch where control flow diverges based on conditions. |
| Join Node | ⬛ Thick Bar | Combines multiple incoming flows into a single outgoing flow. |
| Fork Node | ⬛ Thick Bar | Splitting a single flow into multiple parallel flows. |
| Object Node | ⬜ Rectangle | Represents data or objects moving between activities. |
| Control Flow | ➡️ Arrow Line | Shows the direction of the flow between nodes. |
Understanding these visual elements allows you to construct diagrams that are readable and understandable by both technical and non-technical team members.
🔄 Structural Elements of Activity Diagrams
Beyond individual symbols, activity diagrams have structural features that organize complexity. These features help manage large-scale processes without creating visual clutter.
1. Swimlanes
Swimlanes divide the diagram into distinct areas, typically representing different actors, roles, or system components. This helps clarify who or what is responsible for each activity.
- Actor Swimlanes: Separate user actions from system actions.
- Department Swimlanes: Distinguish between marketing, sales, and engineering workflows.
- System Swimlanes: Isolate backend processes from frontend interactions.
When an activity moves from one swimlane to another, it indicates a handoff or interaction between different entities.
2. Partitioning
Partitioning is closely related to swimlanes but can also represent different states or subsystems. It allows the diagram to show how a single process might look different depending on the context or environment.
3. Object Flows
While control flow shows the order of operations, object flow shows the movement of data. For example, a user fills out a form (control flow), and the form data is passed to a database (object flow). Object nodes are represented as rectangles with a specific label, and the flow lines are dashed or labeled to indicate the type of data being transferred.
📝 How to Create an Activity Diagram
Creating an effective activity diagram requires a logical approach. Follow these steps to ensure clarity and accuracy.
- Define the Scope: Determine the starting point and the ending point of the process. What triggers the activity? What is the desired outcome?
- Identify the Actors: List the participants involved. Will this involve a user, a third-party API, or an internal service?
- Map the Actions: List every step required to move from start to finish. Be specific about what happens at each stage.
- Insert Decision Points: Where does the process branch? Use diamond shapes to mark conditions that alter the path.
- Handle Parallelism: Identify steps that can happen simultaneously. Use fork and join nodes to manage these concurrent threads.
- Review and Refine: Walk through the diagram logically. Ensure every path leads to a valid end node and that no dead ends exist.
It is essential to keep the diagram focused. A single diagram should not attempt to model an entire system. Instead, break complex systems into smaller, manageable sub-processes.
🌐 Real-World Applications
Activity diagrams are not just theoretical constructs; they solve practical problems in software engineering and business analysis.
1. Business Process Modeling
Business analysts use these diagrams to document existing workflows. By visualizing a process, teams can identify inefficiencies. For instance, a diagram might reveal that a specific approval step is repeated unnecessarily across different departments.
2. System Design and Logic
Developers use activity diagrams to plan the logic of a specific feature. Before implementing a login system, a team might draft the activity diagram to ensure error handling, session management, and authentication checks are all covered.
3. Algorithm Visualization
Complex algorithms can be difficult to explain in code alone. An activity diagram breaks down the logic into a visual sequence. This is particularly useful for explaining sorting algorithms, search paths, or data processing pipelines to junior team members.
4. User Interface Workflows
UI designers map out the user journey. This includes what happens when a user clicks a button, waits for a response, or encounters an error. It ensures the user experience is smooth and logical.
⚖️ Activity Diagram vs. Flowchart
While activity diagrams and flowcharts look similar, they serve different purposes. Confusing the two can lead to ambiguity in documentation.
| Feature | Activity Diagram | Flowchart |
|---|---|---|
| Focus | System behavior and logic. | General process or algorithm. |
| Concurrency | Supports parallel flows naturally. | Typically linear or simple branching. |
| Context | Part of UML standards for software. | General business or logic tool. |
| Swimlanes | Standard feature for role separation. | Optional or custom implementation. |
Use flowcharts for general business processes or simple algorithms. Use activity diagrams when you need to model the behavior of a software system specifically, especially when concurrency and state management are involved.
🚫 Common Mistakes to Avoid
Even experienced practitioners can make errors when modeling. Being aware of these pitfalls helps maintain the quality of your documentation.
- Too Much Detail: Do not include every single line of code logic. Keep the diagram at a high level of abstraction. If it gets too complex, break it into sub-diagrams.
- Ignoring Error Paths: A diagram that only shows the “happy path” is incomplete. You must model what happens when inputs are invalid or services fail.
- Inconsistent Symbols: Stick to standard UML notation. Mixing shapes or meanings confuses the reader.
- Dead Ends: Ensure every path eventually leads to a final state. Orphaned flows suggest unfinished logic.
- Missing Swimlanes: If multiple roles are involved, failing to separate them makes it hard to assign responsibility.
💡 Best Practices for Clarity
To make your activity diagrams truly effective, adhere to these guidelines.
1. Keep Labels Concise
Use short, action-oriented labels for activity states. Instead of “The user enters their password and clicks submit,” use “Enter Password” or “Submit Credentials.” This keeps the visual clean and focuses on the action.
2. Use Color Sparingly
While color can help distinguish swimlanes or highlight critical paths, too much color creates visual noise. Rely on shapes and lines first. Use color only to add meaning, such as marking critical failure points.
3. Maintain Hierarchy
If a diagram becomes too large, use object nodes or call behaviors to reference other diagrams. This modular approach keeps the main view clear while allowing deep dives into specific sub-processes.
4. Validate with Stakeholders
A diagram is only useful if the team understands it. Review the draft with developers, testers, and business analysts. Their feedback will highlight gaps in logic or unclear transitions.
🔗 Integrating with Other UML Diagrams
Activity diagrams do not exist in isolation. They work best when used alongside other UML diagrams to provide a complete picture of the system.
- Use Case Diagrams: Define the high-level goals. The activity diagram then details the steps to achieve those goals.
- Sequence Diagrams: Show the interaction between objects. The activity diagram shows the overall flow that drives those interactions.
- State Machine Diagrams: Focus on object states. The activity diagram focuses on the actions that transition those states.
- Class Diagrams: Define the structure. The activity diagram defines the behavior acting on that structure.
Using these diagrams in concert ensures that the design is consistent. The behavior (activity) must match the structure (class) and the interactions (sequence).
🧩 Advanced Concepts
For more complex systems, activity diagrams support advanced features that handle sophisticated logic.
Exception Handling
Real-world systems encounter errors. You can model exceptions by adding branches that lead to error recovery activities. This ensures the diagram reflects reality, not just ideal scenarios.
Repetitive Actions
Loops are common in software. Use a decision node to create a loop back to a previous activity. Label the condition clearly (e.g., “More Data? Yes/No”) to show when the repetition stops.
Asynchronous Behavior
Some tasks take time. You can indicate that a process continues in the background while the main flow waits or moves on. This is crucial for modeling user interfaces that remain responsive while data loads.
📈 The Impact on Development Efficiency
Investing time in creating activity diagrams pays off during the implementation phase. Teams that model their logic first tend to experience fewer bugs and less rework. This is because the logical gaps are identified on paper, not in production.
Furthermore, these diagrams serve as living documentation. When new developers join the team, reviewing the activity diagrams helps them understand the system flow faster than reading raw code. It bridges the gap between technical implementation and business requirements.
🎯 Summary
Activity diagrams are a powerful tool for visualizing the dynamic behavior of software systems. They provide clarity on workflows, parallel processes, and decision points. By mastering the standard symbols, understanding the structural elements like swimlanes, and adhering to best practices, you can create documentation that enhances communication and reduces errors.
Remember that the goal is not perfection but clarity. A simple diagram that conveys the logic effectively is better than a complex one that confuses the reader. Start with small processes, apply the principles outlined here, and gradually tackle more complex system behaviors. With practice, activity diagrams become an essential part of your software engineering toolkit.