
Understanding the syntax and semantics of Unified Modeling Language (UML) is essential for anyone involved in system design or process mapping. Among the various diagram types, the activity diagram stands out as a powerful tool for visualizing workflows and the logic behind complex operations. However, the notation can become dense with specialized terminology. To navigate this landscape effectively, one must possess a clear understanding of the core components that drive these diagrams. This guide provides a detailed breakdown of the most critical terms, ensuring precise communication during technical discussions.
🔍 Why a Glossary Matters in System Modeling
Activity diagrams are not merely pictures; they are executable specifications of behavior. When teams collaborate across disciplines, ambiguity in notation can lead to misinterpretation of requirements. A shared vocabulary bridges the gap between business analysts and software architects. By defining terms like Fork and Join clearly, teams ensure that the intended logic is preserved from design to implementation. This document serves as a reference for these specific concepts, focusing on their functional behavior rather than the tools used to draw them.
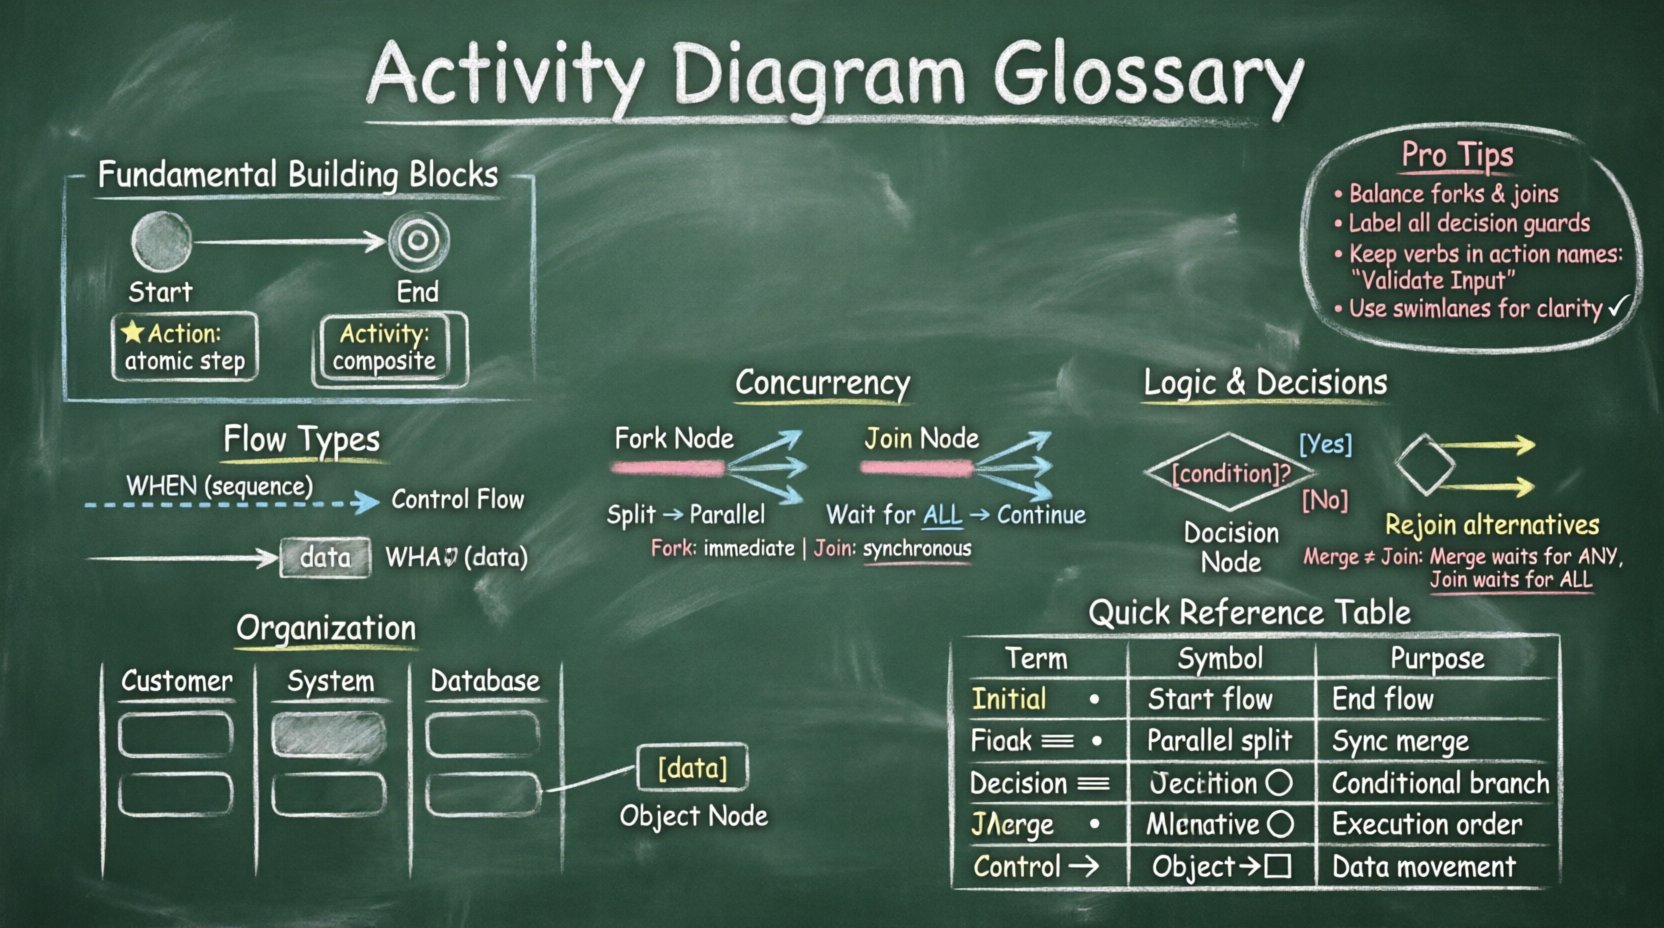
🧱 Fundamental Building Blocks
Every activity diagram relies on a set of nodes and edges. These elements form the backbone of the visual representation. Below are the primary nodes that initiate, process, and terminate activities.
1. Initial Node (Start Node) 🔴
The initial node represents the starting point of an activity. It is depicted as a solid filled circle. There is typically only one initial node per diagram, marking where the control flow begins. Once the flow reaches this node, the activity transitions to the first action or sub-activity.
2. Final Node (End Node) ⚫
Conversely, the final node signifies the successful completion of the activity. It is shown as a solid filled circle within a larger circle. An activity diagram may have multiple final nodes, representing different termination points depending on the outcome of the process. When control reaches this node, the activity ceases.
3. Activity and Action 🛠️
These terms are often used interchangeably, yet they carry distinct meanings in formal modeling:
- Action: An atomic unit of behavior that cannot be subdivided further. It represents a single step, such as “Calculate Tax” or “Send Email”.
- Activity: A composite unit of behavior that can be decomposed into sub-actions. It often represents a larger phase of the process.
🔄 Understanding Flow Types
The lines connecting nodes are known as edges. However, not all edges function identically. Distinguishing between the types of flow is crucial for accurate modeling.
Control Flow vs. Object Flow 📡
This distinction is one of the most significant aspects of activity diagrams. Misusing them can result in diagrams that are logically inconsistent.
- Control Flow: Represents the sequence of execution. It dictates when an action occurs. The arrow indicates the order in which activities are performed. It moves from one node to another to trigger behavior.
- Object Flow: Represents the movement of data or artifacts. It indicates what is being processed. Objects are passed between actions. This flow requires object nodes to be explicitly defined.
When an action is triggered by control flow, it consumes a token. When an action produces data, it outputs an object token. Visualizing the difference helps clarify whether a step is about timing (control) or data manipulation (object).
⚡ Concurrency: Fork and Join
Complex systems often require parallel execution. UML provides specific constructs to model this behavior without creating a chaotic web of arrows.
Fork Node ⬇️
A fork node splits a single incoming flow of control into multiple outgoing flows simultaneously. It is drawn as a thick horizontal bar. When a token arrives at a fork, the control flow is duplicated, sending tokens to all outgoing edges at once. This allows for parallel processing.
Key characteristics of a fork include:
- Splitting: It divides one thread of execution into multiple threads.
- Synchronization Point: It acts as a barrier where the flow diverges.
- No Logic: A fork node does not contain logic or conditions; it simply passes control to all connected paths.
Join Node ⬆️
A join node merges multiple incoming flows into a single outgoing flow. It is also depicted as a thick horizontal bar, similar to the fork but oriented to receive multiple inputs. For the control flow to proceed past a join node, tokens must arrive from all incoming edges.
Consider the following scenario regarding a join node:
- Wait for Completion: If three threads of execution are running in parallel, the join node will wait until all three threads have completed their tasks.
- Resynchronization: Once all inputs are present, the flow continues along the single outgoing edge.
- Blocking: If one thread is delayed, the entire process pauses at the join point.
Comparing Fork and Join 📋
| Feature | Fork Node | Join Node |
|---|---|---|
| Function | Splits flow into parallel paths | Merges parallel paths into one |
| Token Consumption | One input token creates multiple output tokens | Multiple input tokens are consumed to create one output token |
| Visual Shape | Thick bar (horizontal) | Thick bar (horizontal) |
| Execution Logic | Immediate branching | Waiting for all inputs |
🧩 Logic and Decision Making
Real-world processes are rarely linear. Decisions must be made based on conditions, and multiple paths often lead to the same outcome.
Decision Node 🛑
A decision node introduces branching logic based on a condition. It is drawn as a diamond shape. Unlike a fork, a decision node has multiple outgoing edges, but only one path is taken based on the evaluation of the condition.
Best practices for decision nodes include:
- Exhaustive Conditions: Ensure all possible outcomes are covered. If a condition is “Is Amount > 100?”, there should be an “Yes” path and a “No” path.
- Clear Labels: Every outgoing edge must have a guard condition (e.g., [true], [false], [error]) to clarify the logic.
- Single Input: A decision node typically has only one incoming edge, though multiple can be modeled in complex scenarios.
Merge Node 🔄
A merge node is the inverse of a decision node. It combines multiple incoming paths that were split by a decision back into a single flow. It is also drawn as a diamond shape. Unlike a join node, a merge node does not wait for all inputs. It proceeds as soon as any single input arrives.
Why distinguish merge from join?
- Join: Waits for all parallel tasks to finish (Synchronization).
- Merge: Waits for one task to finish (Rejoining of alternatives).
🌊 Intermediate Nodes and Signals
Beyond the basic flow, activity diagrams utilize intermediate nodes to handle waiting periods or external events.
Wait State (Interruptible Region) ⏳
A wait state represents a period where the activity pauses. It is often used to model timeouts or waiting for a response from an external system. The flow enters this state and remains there until a specified condition is met, such as a timer expiring or a signal received.
Signal Send/Receive 📩
Systems communicate through signals. An activity diagram can model the sending or receiving of these signals.
- Signal Send: Represents an action that emits a signal to another part of the system.
- Signal Receive: Represents an action that waits for a specific signal before proceeding.
🏊 Organizing Work: Swimlanes and Partitions
As diagrams grow in complexity, they become difficult to read. Swimlanes (also known as Partitions) provide structure by grouping activities based on the responsible entity.
Partition / Swimlane 🏊
A swimlane is a visual container that groups activities. It clarifies responsibility without altering the logic of the diagram.
- Role-Based: Swimplanes can represent roles, such as “Customer,” “Server,” or “Database”.
- System-Based: They can also represent different systems or modules.
- Clarity: They help identify handoffs between different entities, which is a common source of errors in system integration.
Object Nodes 📦
Object nodes are specific containers for data. They appear as rectangles with a folded corner. Data flows into these nodes via object flows. They hold the state of objects as they move through the activity.
🚧 Common Modeling Pitfalls
Even experienced modelers can fall into traps that reduce the clarity of the diagram. Awareness of these common issues helps maintain high quality.
1. Unbalanced Forks and Joins
If you fork into three paths, you must ensure you join all three paths before the flow can continue. Leaving a path dangling creates an incomplete process definition.
2. Confusing Merge and Join
Using a join node where a merge node is needed can cause the process to wait unnecessarily. Ensure you understand the difference between synchronization (join) and rejoining alternatives (merge).
3. Overloading Decision Nodes
A decision node with too many outgoing edges becomes hard to read. If a condition has more than three or four outcomes, consider grouping them into sub-activities.
4. Mixing Control and Object Flows
Do not mix control flow arrows with object flow arrows in a confusing manner. Use distinct line styles or colors if allowed by your notation standards, but logically, keep the control logic separate from the data movement logic.
📝 Implementation Guidelines
To create effective activity diagrams, adherence to a set of guidelines ensures consistency and readability.
- Keep it Flat: Avoid deep nesting of sub-activities unless absolutely necessary. Use separate diagrams for complex sub-processes.
- Standard Notation: Stick to standard UML shapes. Deviating from conventions can confuse readers.
- Consistent Terminology: Ensure action names follow a verb-noun structure (e.g., “Validate Input”) rather than abstract nouns.
- Review for Dead Ends: Check that every path eventually leads to a final node. Orphaned paths indicate logic errors.
- Token Counting: Verify that tokens are not lost or created from thin air. Every output node should have a corresponding input node.
🤝 Collaboration and Feedback
Activity diagrams are living documents. They should evolve as the system requirements change. When presenting these diagrams to stakeholders, focus on the flow of value. Explain how the fork and join nodes impact the overall timeline of the process. Highlight where bottlenecks might occur due to synchronization points. This level of detail transforms a simple diagram into a strategic asset for process improvement.
📚 Summary of Key Terms
Below is a quick reference for the terms discussed in this guide.
| Term | Symbol | Definition |
|---|---|---|
| Initial Node | Filled Circle | Start of the activity flow |
| Final Node | Circle with Dot | End of the activity flow |
| Fork | Thick Bar | Splits flow into parallel paths |
| Join | Thick Bar | Merges parallel paths |
| Decision Node | Diamond | Branches flow based on condition |
| Merge Node | Diamond | Rejoins alternative paths |
| Control Flow | Arrow | Sequence of execution |
| Object Flow | Arrow with Object | Movement of data |
| Swimlane | Box | Groups activities by owner |
🔗 Conclusion on Modeling
Mastery of the activity diagram glossary enables clearer communication and more robust system designs. By understanding the nuances between control and object flow, and the specific behaviors of fork and join nodes, modelers can create diagrams that are not only visually appealing but also logically sound. These tools facilitate a deeper understanding of process dynamics, allowing for better identification of bottlenecks and opportunities for optimization. As you continue to apply these concepts, focus on precision and clarity above all else.