
Visualizing how software components interact is a critical skill for system architects and developers. Communication diagrams offer a unique perspective on object interactions, focusing on the relationships and message flow between system elements. Unlike other modeling techniques that prioritize time, this approach highlights structural connections. This guide provides a detailed walkthrough on creating these diagrams effectively, ensuring your system design is clear, maintainable, and logically sound.
1. Understanding Communication Diagrams 🧩
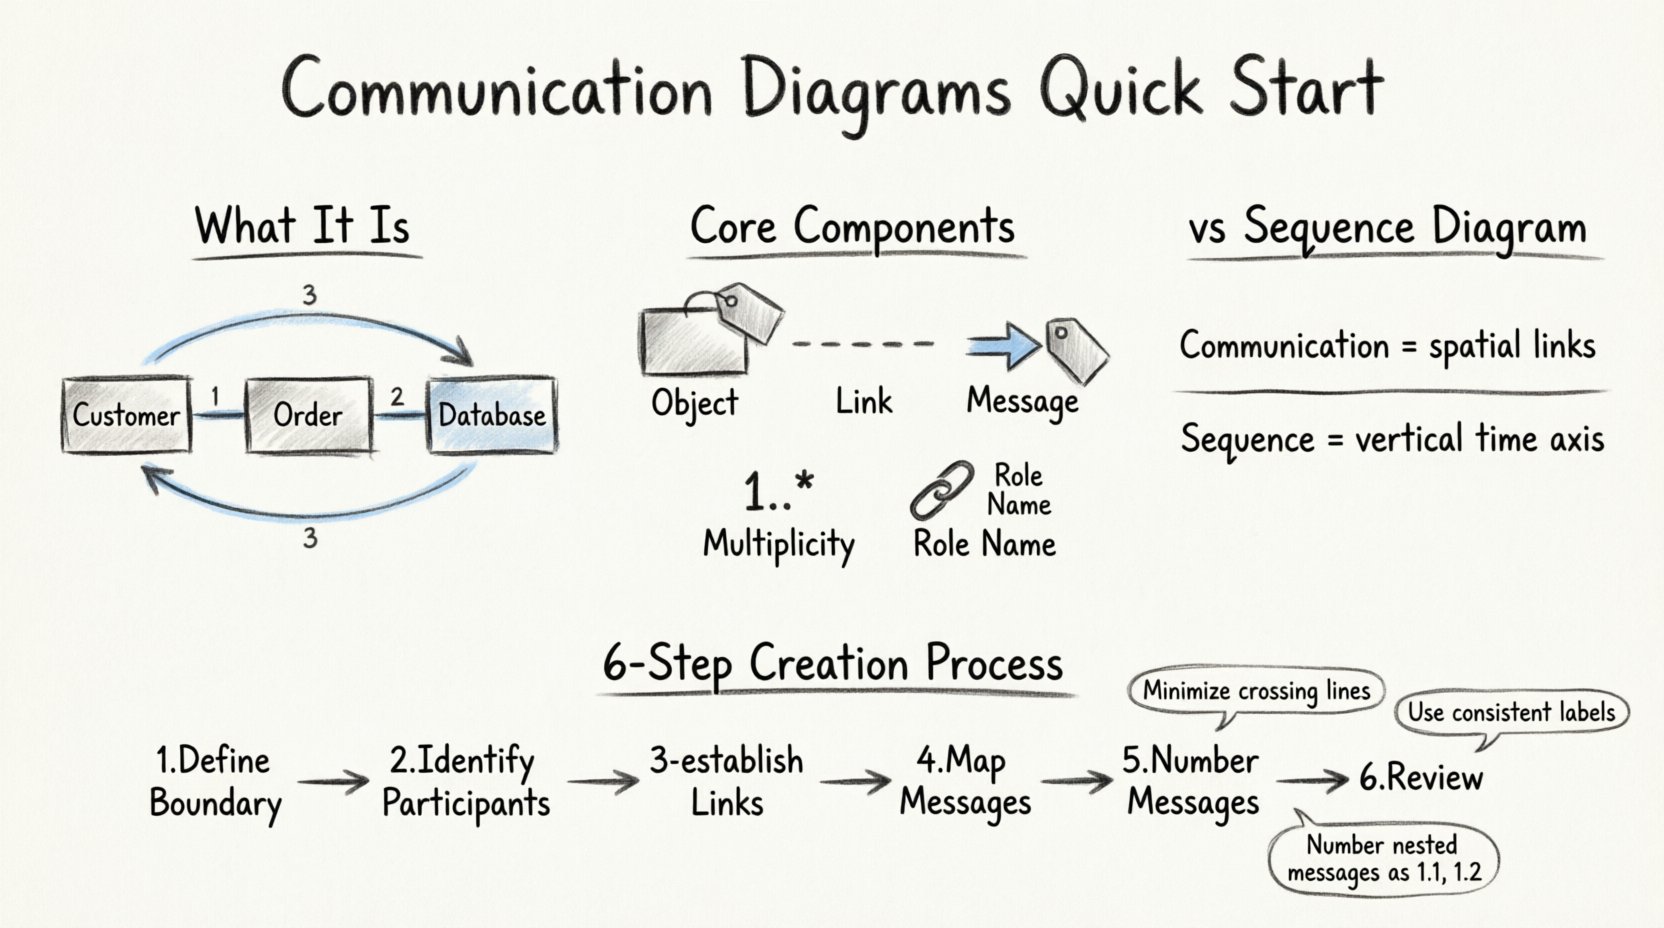
A communication diagram is a type of interaction diagram used in the Unified Modeling Language (UML). Its primary purpose is to show how objects in a system interact to achieve a specific result. While sequence diagrams are often preferred for showing the timing of events, communication diagrams excel at displaying the structural organization of objects.
When you look at a communication diagram, you see objects placed in a spatial arrangement. These objects are connected by lines, representing links. Messages flow between these objects along the lines. This visual layout allows you to see the topology of the interaction at a glance. It is particularly useful for understanding complex relationships where multiple objects must communicate simultaneously.
Key characteristics include:
- Focus on Relationships: The emphasis is on the links between objects rather than the strict sequence of time.
- Flexibility in Layout: Objects can be positioned to reduce line crossings and improve readability.
- Message Numbering: Although time is not the primary axis, messages are numbered to indicate the order of execution.
- Object Instances: They typically depict specific instances of classes rather than general class definitions.
2. Core Components Explained 🛠️
To construct a valid communication diagram, you must understand the fundamental building blocks. Each element serves a specific function in defining the behavior of the system.
2.1 Objects
Objects represent instances of classes. In the diagram, they are usually depicted as rectangles with the object name and class name. For example, a Customer object might be labeled as 1:Customer, where the number indicates multiplicity or instance ID.
2.2 Links
Links are the lines connecting objects. They represent the association between objects. A link indicates that one object can send a message to another. It is crucial to ensure that links only exist between objects that are logically connected in the system architecture.
2.3 Messages
Messages are the arrows indicating the flow of information. They are labeled with the operation name and arguments. Messages can be synchronous (waiting for a response) or asynchronous (sending without waiting). The direction of the arrow shows the sender and the receiver.
2.4 Multiplicity
Multiplicity defines how many instances of an object participate in the interaction. For example, a 1 means exactly one, while a * means zero or more. This helps define the scope of the interaction.
2.5 Object Roles
Links often have role names. These names describe the function of the object from the perspective of the other object. For instance, a link between a System and a Database might have the role Provider on the Database side.
3. Communication Diagram vs. Sequence Diagram 🆚
Choosing between a communication diagram and a sequence diagram depends on the information you need to convey. Both are interaction diagrams but serve different analytical purposes.
| Feature | Communication Diagram | Sequence Diagram |
|---|---|---|
| Primary Focus | Structural relationships and object links. | Time sequence and chronological order. |
| Layout | Flexible spatial arrangement of objects. | Objects arranged horizontally or vertically with a time axis. |
| Readability | Better for complex object networks. | Better for linear process flows. |
| Message Order | Indicated by numbering (1, 2, 3). | Indicated by vertical position (top to bottom). |
| Use Case | Understanding component connectivity. | Understanding step-by-step execution. |
While sequence diagrams are excellent for tracing a specific request from start to finish, communication diagrams are superior when you need to show how a group of objects collaborates. They reduce the visual clutter of lifelines and activation bars found in sequence diagrams.
4. Step-by-Step Creation Process 📝
Creating a communication diagram involves a logical progression. You do not need specific software to begin; a blank canvas and a clear understanding of the system logic are sufficient.
Step 1: Define the Boundary
Identify the scope of the interaction. What is the trigger? Is it a user action, an external event, or an internal system call? Define the starting object that initiates the process.
Step 2: Identify Participants
List all objects involved in the process. Avoid including objects that do not directly participate in the specific interaction. Focus on the essential actors and components.
Step 3: Establish Links
Draw connections between the objects. Ensure that every link represents a real association in the system. If Object A needs to talk to Object B, draw a line between them.
Step 4: Map the Messages
Determine the sequence of operations. Draw arrows between the linked objects. Label each arrow with the method name or operation being called.
Step 5: Number the Messages
Assign numbers to the messages to indicate the flow order. Use sequential integers for the main flow. Use decimal points for recursive or nested messages.
Step 6: Review and Refine
Check for clarity. Are the lines crossing unnecessarily? Are the labels readable? Adjust the layout to minimize visual noise.
5. Managing Message Flow and Numbering 🔢
Numbering is the mechanism that replaces the vertical time axis found in sequence diagrams. It provides a strict order of execution.
5.1 Sequential Messages
Messages are numbered 1, 2, 3, etc. This indicates that message 1 must complete before message 2 begins. This is the standard flow for linear processes.
5.2 Nested Messages
When an object sends a message in response to a previous message, it is nested. For example, if message 1 triggers an action that calls message 1.1, the numbering reflects this hierarchy. This helps in understanding sub-processes.
5.3 Loops and Conditions
For iterative processes, you can use labels like loop or alt. These indicate that a message or group of messages repeats or depends on a condition. While less common in communication diagrams than sequence diagrams, they are still applicable.
5.4 Return Messages
Return messages are often shown as dashed arrows. They are usually not numbered unless the return value is significant to the caller. In many cases, the return is implied by the completion of the call.
6. Design Principles for Clarity 🎯
Clarity is the most important metric for a successful diagram. If the diagram confuses the reader, it fails its purpose.
6.1 Minimize Crossing Lines
Arrange objects so that message lines do not cross each other. Crossing lines create visual confusion and make it hard to trace the path of a message. Use a layout strategy that groups related objects together.
6.2 Consistent Labeling
Use consistent naming conventions for objects and messages. If you use getUser in one place, do not use fetchUser elsewhere for the same action. Consistency reduces cognitive load.
6.3 Limit Object Count
Do not include every object in the system. A communication diagram should focus on a specific scenario. If the interaction involves too many objects, break it down into multiple diagrams.
6.4 Use Role Names
Label the links with role names. This adds context to the connection. For example, a link between a Controller and a Service can be labeled Invokes. This explains how they relate.
7. Common Pitfalls to Avoid ⚠️
Even experienced designers make mistakes. Being aware of common errors can save time during the review process.
- Ignoring Multiplicity: Forgetting to indicate how many objects are involved can lead to ambiguity about data volume.
- Overcrowding: Trying to fit too many interactions into one diagram makes it unreadable. Split complex flows.
- Inconsistent Numbering: Skipping numbers or using non-sequential logic confuses the reader about the execution order.
- Missing Return Paths: If a message requires a response, ensure it is represented, even if implicit.
- Unclear Object Names: Generic names like
Object1provide no value. Use descriptive names likeOrderProcessor.
8. When to Choose This Diagram 🤔
Understanding the right time to use a communication diagram is as important as knowing how to draw one.
8.1 Complex Object Networks
When a scenario involves many objects interacting in a web-like structure, a sequence diagram becomes a vertical wall of text. A communication diagram flattens this view.
8.2 Architectural Reviews
During design reviews, stakeholders often need to see the high-level connections. Communication diagrams provide a good overview of system topology.
8.3 Documentation
For technical documentation, these diagrams help developers understand the dependencies between modules. They serve as a map of the code structure.
8.4 Legacy System Analysis
When analyzing older systems, understanding the link structure is often more valuable than the timing. Communication diagrams highlight these structural dependencies.
9. Advanced Techniques and Variations 📐
Beyond the basics, there are advanced techniques to enhance the utility of your diagrams.
9.1 Aggregation and Composition
You can use specific link styles to denote strong relationships. A filled diamond indicates composition, while a hollow diamond indicates aggregation. This adds semantic depth to the links.
9.2 Dynamic Objects
In some cases, objects are created or destroyed during the interaction. You can show this by using a specific notation to indicate the creation and destruction of instances.
9.3 Combining with State Diagrams
While communication diagrams show interactions, they do not show internal state changes. You can reference state diagrams to explain why an object behaves a certain way during a message exchange.
10. Summary and Final Thoughts 💡
Communication diagrams are a powerful tool for visualizing system interactions. They prioritize the structural relationships between objects, offering a clear view of how components collaborate. By focusing on links and message numbering, they provide a flexible way to model complex behaviors without the rigidity of time-based axes.
Following the steps outlined in this guide ensures that your diagrams are accurate and easy to interpret. Remember to prioritize clarity, minimize visual clutter, and use consistent naming conventions. Whether you are designing a new system or documenting an existing one, these diagrams facilitate better communication among team members.
Start by identifying your core objects and their connections. Number your messages logically. Review your work against the principles of clarity. With practice, you will be able to draw effective diagrams that enhance your system design and documentation.
Adopting these practices leads to more robust software architectures. The effort invested in clear modeling pays dividends during development and maintenance phases. Keep your diagrams updated as the system evolves to maintain their value as documentation.
Ultimately, the goal is to convey information efficiently. If your diagram allows a developer to understand the flow without asking questions, it has succeeded. Use this guide as a foundation for your modeling journey.