
In the rapidly evolving landscape of technology, information systems students must possess more than just coding proficiency. They require the ability to visualize, analyze, and document complex interactions between system components. Among the various modeling techniques available, Communication Diagrams stand out as a critical tool for understanding object interactions. These diagrams provide a clear, relational view of how data flows through an application, making them indispensable for academic success and professional growth.
Understanding Communication Diagrams in System Design 🛠️
A Communication Diagram is a type of interaction diagram used in Unified Modeling Language (UML). It focuses on the structural organization of objects rather than the strict chronological timing of events. While other diagrams emphasize the sequence of messages, Communication Diagrams prioritize the relationships between objects. This distinction is vital for students learning to design scalable architectures.
When creating these diagrams, the primary goal is to map out how objects collaborate to achieve a specific system function. This involves identifying:
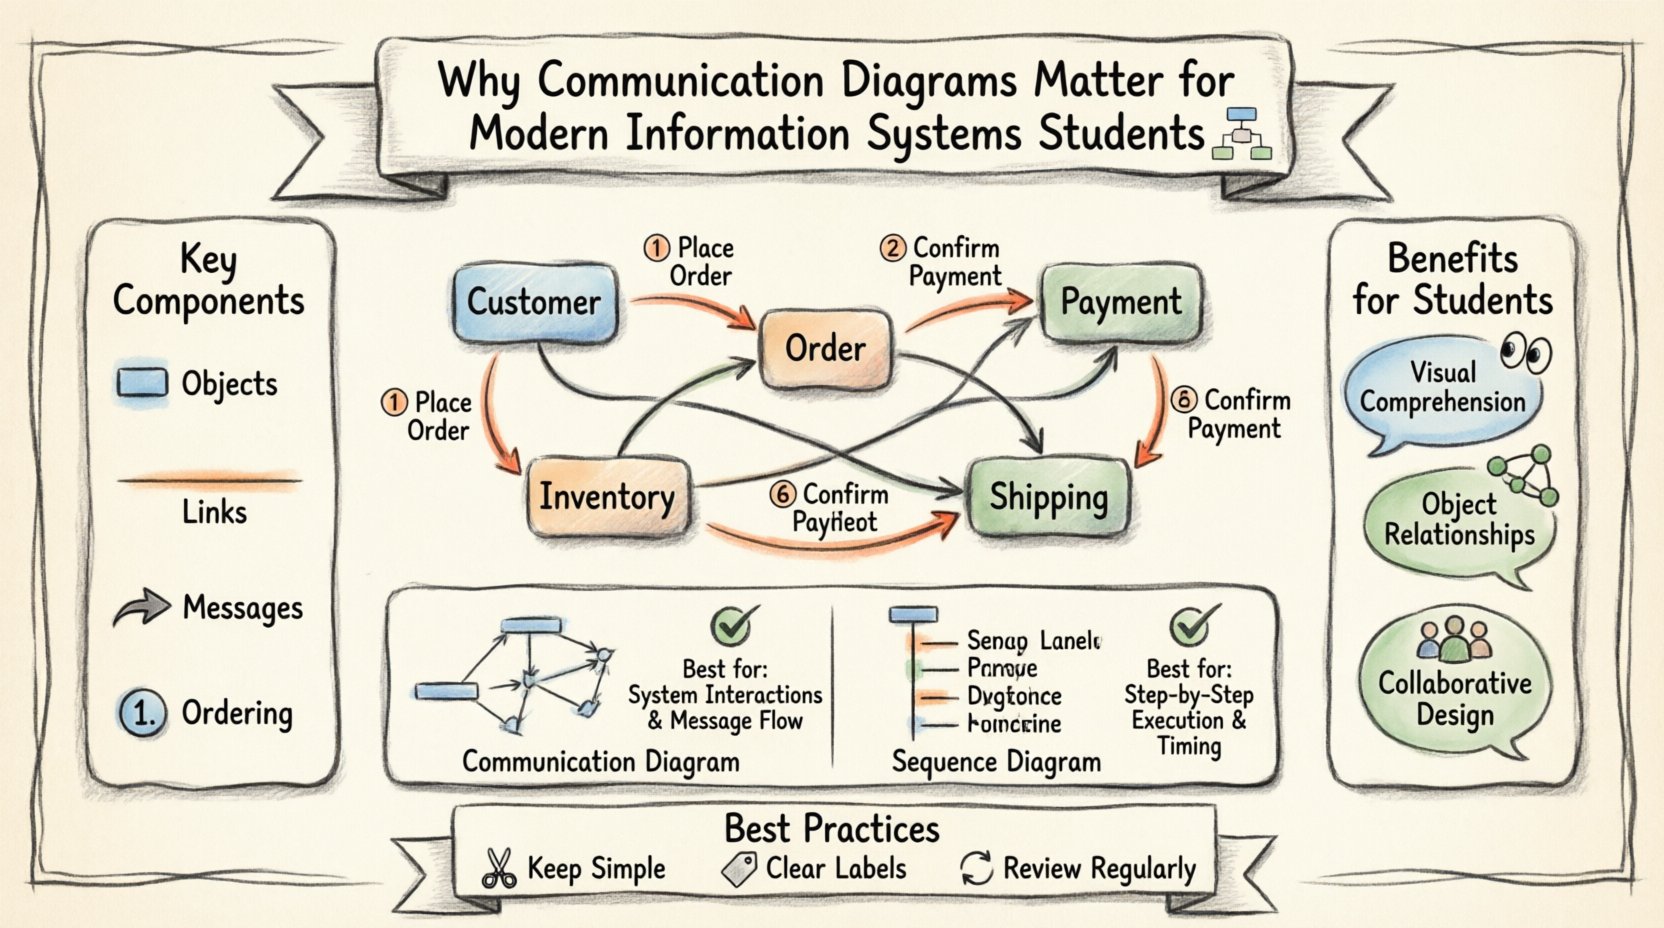
- Objects: The distinct entities participating in the interaction.
- Links: The connections that allow objects to communicate with one another.
- Messages: The signals or data passed between objects to trigger actions.
- Ordering: The sequence in which messages are exchanged, often indicated by numbers.
Unlike a Sequence Diagram, which uses a vertical timeline to represent time progression, a Communication Diagram uses a spatial layout. This approach allows students to see the topology of the system at a glance. It reveals which objects are central to the process and which are peripheral, aiding in the identification of bottlenecks or single points of failure.
The Strategic Value for Information Systems Students 💡
For those studying information systems, understanding the architecture of software is just as important as writing the code itself. Communication Diagrams offer several distinct advantages that enhance both learning and professional capability.
1. Enhanced Visual Comprehension
Complex systems often involve dozens of classes and methods interacting in non-linear ways. Text-based descriptions can become confusing quickly. Visual representations bridge the gap between abstract logic and concrete structure. By mapping these interactions, students can:
- Identify dependencies between modules early in the design phase.
- Reduce the cognitive load required to understand system behavior.
- Communicate ideas more effectively with team members who may not code.
2. Focus on Object Relationships
In many development methodologies, the object-oriented paradigm is dominant. This means the system is built around objects that hold data and perform actions. Communication Diagrams align perfectly with this paradigm. They explicitly show:
- Which objects hold references to other objects.
- How instances of classes are connected at runtime.
- The navigational paths available within the system.
This focus helps students grasp the concept of encapsulation and coupling. By visualizing the links, they can see where coupling might be too high, leading to fragile code that is difficult to maintain.
3. Facilitating Collaborative Design
Modern software development is rarely a solitary endeavor. Teams collaborate on design specifications before implementation begins. Communication Diagrams serve as a universal language for these teams. They allow architects, developers, and testers to discuss system behavior without ambiguity. When a team reviews a diagram, they can spot missing connections or logical errors before a single line of code is written.
Comparison: Communication vs. Sequence Diagrams 📊
Students often encounter both Communication Diagrams and Sequence Diagrams during their coursework. While both depict interactions, they serve different purposes. Understanding when to use each is a key skill.
| Feature | Communication Diagram | Sequence Diagram |
|---|---|---|
| Primary Focus | Structural organization of objects. | Time sequence of messages. |
| Layout | Flexible spatial arrangement. | Vertical timeline with horizontal messages. |
| Readability | Good for understanding relationships. | Good for understanding flow and timing. |
| Complexity | Can become cluttered with many objects. | Can become long with many messages. |
| Use Case | High-level architectural overview. | Detailed procedural logic. |
For information systems students, mastering both types provides a comprehensive toolkit. However, Communication Diagrams are particularly useful when the focus is on the network of objects rather than the precise timing of events.
Key Components and Notation 📝
To utilize Communication Diagrams effectively, students must understand the standard notation used in the industry. This ensures that the diagrams created are interoperable and understandable by others.
- Object Instances: Represented by rectangles with the object name and instance number (e.g.,
1:Customer). This distinguishes specific instances from the class definition. - Links: Lines connecting objects. They represent associations or relationships defined in the class diagram.
- Messages: Arrows indicating the flow of information. They include the method name and parameters.
- Sequence Numbers: Small numbers placed near the message arrows. These clarify the order of execution, especially when messages cross paths.
- Return Messages: Dashed arrows indicating a response from the receiver back to the sender.
Adhering to these notations prevents misinterpretation. A student who creates a diagram with custom symbols may confuse peers or future maintainers of the project. Standardization is a hallmark of professional work.
Best Practices for Academic Projects 📚
When applying these diagrams to university assignments or capstone projects, following established guidelines ensures higher grades and better outcomes. Consider the following recommendations:
- Keep it Simple: Do not attempt to diagram the entire system in one view. Break down complex systems into smaller, manageable scenarios. Focus on one use case per diagram.
- Limit Object Count: If a diagram becomes too crowded, it loses its value. Split the interactions into multiple diagrams if necessary.
- Use Clear Labels: Message labels should be concise but descriptive. Avoid vague terms like “process data”; instead, use “validateCredentials”.
- Consistent Naming: Ensure object names match the class names in the codebase. This creates a direct link between the design and the implementation.
- Review Regularly: As the system evolves, the diagrams must be updated. Outdated diagrams are worse than no diagrams because they mislead the developer.
Common Pitfalls to Avoid ⚠️
Even experienced designers make mistakes. Students should be aware of common errors to ensure their work remains accurate and useful.
- Ignoring Return Messages: Focusing only on the request and ignoring the response can hide critical error handling logic.
- Overusing Numbers: While sequence numbers are helpful, excessive numbering can clutter the visual. Use them only where the flow is non-linear.
- Confusing Links with Messages: A link represents a permanent relationship, while a message is a temporary signal. Do not use a message arrow to represent a static association.
- Missing Null Checks: In real-world systems, links may be null. Diagrams often assume perfect connectivity, which can lead to runtime errors if not considered in the logic.
Real-World Application in Software Engineering 🌐
The skills gained from creating Communication Diagrams extend far beyond the classroom. In professional environments, these diagrams are part of the broader documentation strategy. They are often used during code reviews to explain why a certain design choice was made.
Consider a scenario where a team is refactoring a legacy system. The original documentation is missing or inaccurate. A developer might reconstruct the Communication Diagrams based on the existing code to understand the hidden dependencies. This reverse-engineering process is a common task in maintenance projects.
Furthermore, in agile development environments, these diagrams can be created rapidly to facilitate discussions during sprint planning. They help teams visualize the impact of a new feature before committing to the code. This reduces the risk of breaking existing functionality.
Integrating with Other Design Models 🧩
Communication Diagrams do not exist in isolation. They are part of a larger ecosystem of design models. To be an effective information systems student, one must understand how these diagrams relate to others.
- Class Diagrams: Provide the static structure. Communication Diagrams show the dynamic behavior based on that structure.
- Use Case Diagrams: Define the high-level goals. Communication Diagrams show the internal steps to achieve those goals.
- State Machine Diagrams: Describe the lifecycle of an object. Communication Diagrams show how objects interact during specific state transitions.
By weaving these models together, students create a complete picture of the system. This holistic view is essential for designing robust information systems that meet user requirements.
Career Implications and Industry Standards 🚀
Employers in the software industry value candidates who can communicate technical concepts clearly. The ability to produce clean, accurate diagrams is a soft skill that translates directly to job performance.
When applying for roles such as Systems Analyst, Software Architect, or Full Stack Developer, portfolios often include design documentation. A well-documented project with clear Communication Diagrams demonstrates attention to detail and architectural thinking.
Additionally, many development frameworks and methodologies encourage documentation. While some teams prefer code over diagrams, the ability to visualize the system remains a differentiator. It shows that the candidate understands the big picture and not just the syntax of the programming language.
Final Thoughts on Design Visualization 🧭
Mastering the art of diagramming is a journey that requires practice and patience. For information systems students, the effort invested in learning Communication Diagrams pays dividends in comprehension and career readiness. These tools transform abstract requirements into tangible structures, making the invisible visible.
As technology continues to advance, the complexity of systems will only increase. The ability to break down that complexity into understandable interactions will remain a fundamental skill. Students who embrace these modeling techniques position themselves to lead in the design and development of future information systems.
By focusing on relationships, clarity, and standardization, learners can create diagrams that serve as lasting assets for their projects. The knowledge gained extends beyond the immediate assignment, providing a foundation for lifelong professional growth in the field of software engineering.