
Designing robust software systems requires more than just writing code. It demands clear planning, precise visualization, and a shared understanding among team members. For undergraduate engineers entering the field of software development, understanding Unified Modeling Language (UML) is a foundational skill. Among the various diagrams in the UML suite, the Communication Diagram offers a unique perspective on how objects interact within a system.
This handbook provides a deep dive into Communication Diagrams. We will explore their structure, creation process, and practical application in engineering projects. By the end of this guide, you will possess the knowledge to model system behavior effectively without relying on specific tools or proprietary software.
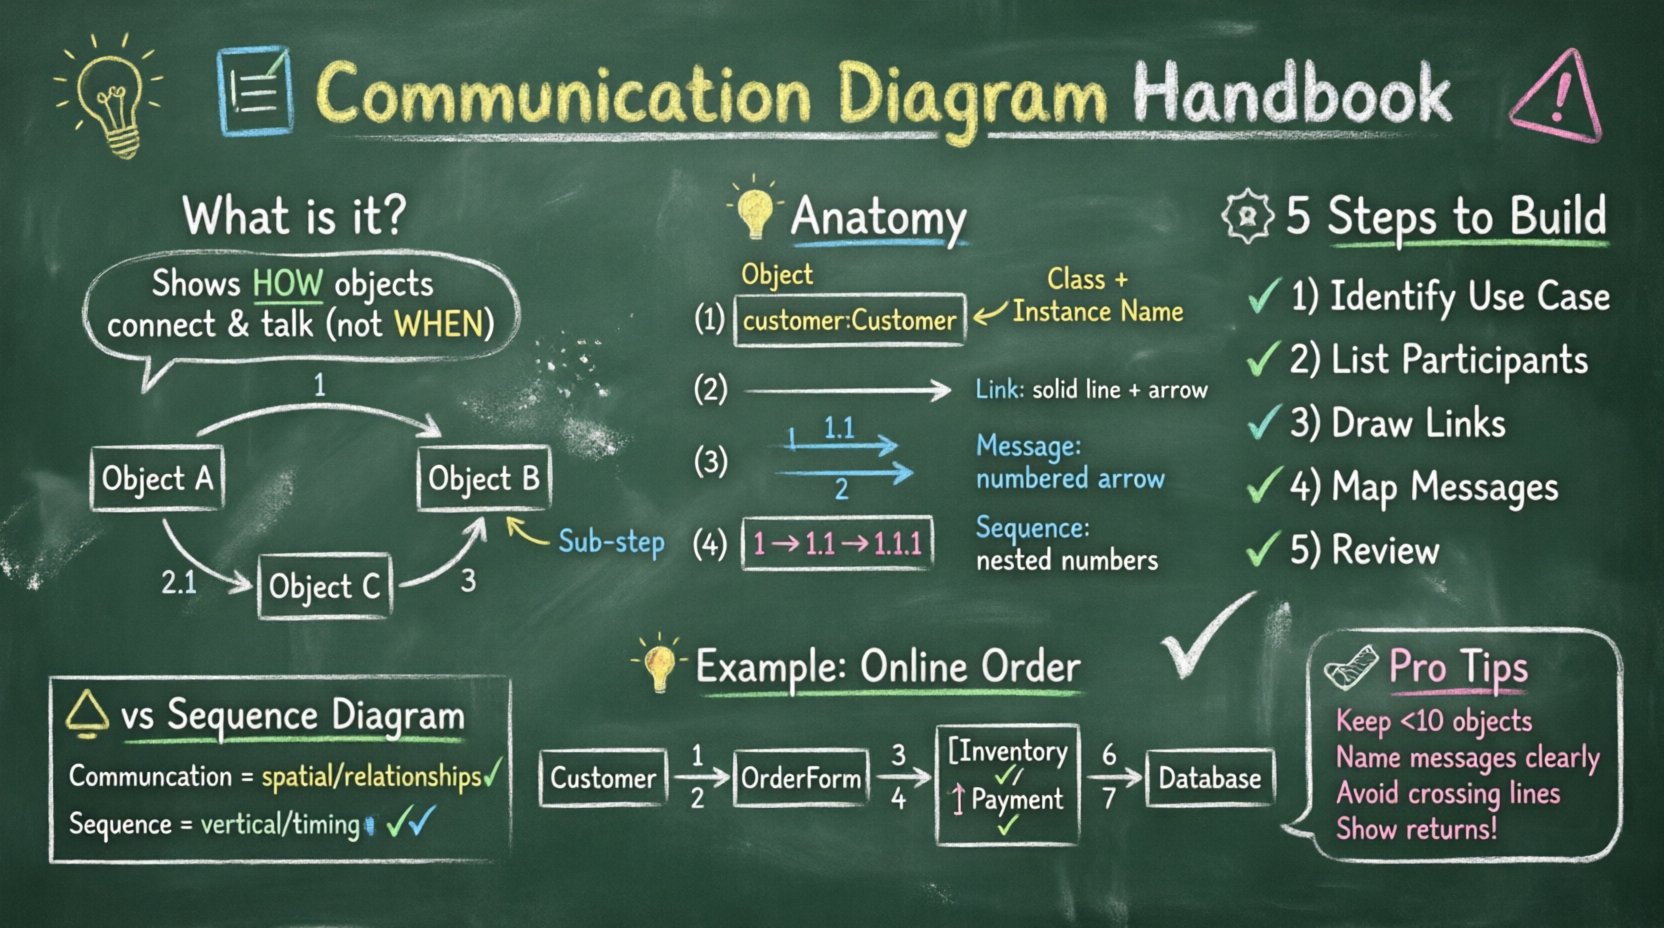
What is a Communication Diagram? 🤔
A Communication Diagram, formerly known as a Collaboration Diagram in UML 1.x, is a type of interaction diagram. It focuses on the structural organization of objects and their relationships rather than the strict timing of messages. While it conveys similar information to a Sequence Diagram, it presents that information in a spatial layout that emphasizes connections.
In the context of undergraduate engineering, this diagram helps visualize:
Object Relationships: How different components of your system connect physically or logically.
Message Flow: The order in which data or commands are passed between objects.
Complexity: How intricate the interaction logic is within a specific use case.
Unlike other diagrams that prioritize time (vertical flow), Communication Diagrams prioritize topology (horizontal/structural flow). This makes them particularly useful for understanding the architecture of a distributed system or a complex object-oriented design.
Anatomy of a Communication Diagram 🧩
To create an accurate diagram, you must understand the standard elements used to construct it. Each element serves a specific purpose in defining the interaction.
1. Participants (Objects) 🖥️
Participants represent the objects involved in the interaction. In a UML diagram, these are typically depicted as boxes containing the class name and, optionally, the instance name (e.g., customer: Customer). Each box represents a distinct entity that performs an action or holds data.
2. Links (Associations) 🔗
Links represent the connections between participants. These are the structural pathways through which messages travel. A link indicates that one object has knowledge of another object. Without a link, objects cannot communicate directly in the diagram.
Solid Lines: Represent direct associations between objects.
Arrowheads: Indicate the direction of the relationship (who knows whom).
3. Messages 💬
Messages are the interactions that occur between objects. They are drawn as arrows connecting the participants. Unlike sequence diagrams, messages in a communication diagram are not necessarily arranged vertically by time. Instead, they are numbered to indicate the sequence of execution.
Key message types include:
Synchronous: The sender waits for a response before continuing.
Asynchronous: The sender continues immediately after sending the message.
Return: Indicates data or control flow returning to the original sender.
4. Sequence Numbers 🔢
To maintain order without strict vertical alignment, messages are prefixed with numbers (1, 1.1, 1.2, 2, etc.). This hierarchy allows you to show nested calls and returns clearly.
How to Build a Communication Diagram 🛠️
Constructing a diagram requires a systematic approach. Follow these steps to ensure accuracy and clarity in your engineering models.
Step 1: Identify the Use Case 📋
Start by defining the specific scenario you are modeling. Is it a user logging in? Is it a payment processing transaction? A clear use case scope prevents the diagram from becoming cluttered with irrelevant interactions.
Step 2: Identify Participants 🧑💼
List all the objects involved in this scenario. Look at your class diagram to find the relevant classes. Filter out objects that do not play a direct role in this specific interaction.
Step 3: Define the Links 🔗
Draw the connections between the participants. Ensure that only objects that have a direct association are connected. If Object A needs to talk to Object B, there must be a link between them.
Step 4: Map the Message Flow 🔄
Draw arrows to represent the messages. Assign sequence numbers to each message. Start with 1 for the initial trigger. If a message triggers another call within the same scope, use sub-numbers like 1.1 or 1.2.
Step 5: Review and Refine 🧐
Check for logical errors. Can the objects actually communicate? Is the flow of data consistent with the system requirements? Ensure that every message has a corresponding return message where appropriate.
Communication Diagram vs. Sequence Diagram ⚖️
Engineers often confuse Communication Diagrams with Sequence Diagrams. While both model interactions, they highlight different aspects of the system design. Understanding the distinction is crucial for selecting the right tool for documentation.
Feature | Communication Diagram | Sequence Diagram |
|---|---|---|
Focus | Structural organization of objects | Time-ordered sequence of messages |
Layout | Spatial (horizontal/clustered) | Linear (vertical) |
Clarity | Better for showing object relationships | Better for showing timing and duration |
Complexity | Can get messy with high message counts | Handles high message counts well |
Use Case | Architectural overview, object links | Algorithm flow, timing analysis |
For undergraduate engineering projects, use Sequence Diagrams when timing matters. Use Communication Diagrams when the structural relationship between components is the primary concern.
Notation Rules and Standards 📝
Consistency in notation ensures that your diagrams are readable by peers and instructors. Adhere to the following standards to maintain professional quality.
Message Direction: Arrows must point from the sender to the receiver. Misplaced arrows can invert the logic of your system.
Activation Bars: While less common in pure communication diagrams, you may include bars to show when an object is actively processing a request.
Return Messages: These are often shown as dashed lines or arrows labeled with the return value. Do not omit these if data is being passed back.
Loops: If a message is sent repeatedly, label the arrow with
loopand specify the condition (e.g.,while (isValid)).Alt/Opt: For alternative paths (if/else), label the messages clearly to indicate branching logic.
Common Patterns for Engineering Students 🔄
Certain interaction patterns appear frequently in software engineering. Recognizing these patterns helps you draft diagrams faster and with higher accuracy.
1. Request-Response Pattern
The most basic interaction. Object A sends a request to Object B, and Object B returns a result.
Message 1: Request Data
Message 2: Return Data
2. Chain Pattern
Object A passes a message to Object B, which then passes a message to Object C. This is common in middleware or service layer architectures.
Message 1: Forward to B
Message 2: Forward to C
Message 3: Return to A
3. Conditional Pattern
Depending on a condition, different objects are contacted. This requires clear labeling of the decision point.
4. Iterative Pattern
One object sends a message to another repeatedly until a condition is met. Use the loop notation to indicate this behavior.
Best Practices for Clarity 🎓
A diagram is only useful if it is understood. Follow these guidelines to ensure your work is professional and easy to interpret.
Keep it Simple: Do not try to model the entire system in one diagram. Break complex systems down into smaller use cases.
Limit Object Count: If you have more than 10 objects, the diagram becomes unreadable. Split the diagram into multiple views.
Use Meaningful Names: Name your messages clearly (e.g.,
calculateTax()instead of justsend()).Avoid Crossing Lines: Try to arrange objects so that message arrows do not cross each other excessively. This reduces visual noise.
Standardize Symbols: Ensure all arrows, boxes, and text use the same style and font size.
Common Mistakes to Avoid 🚨
Even experienced engineers make errors when modeling systems. Be aware of these common pitfalls to save time during code review or grading.
Ignoring Links: Drawing a message between two objects without drawing a link between them implies a connection that does not exist.
Incorrect Sequencing: Numbering messages out of order can confuse the logic flow. Ensure sub-messages (1.1) are nested within their parent (1).
Missing Returns: Forgetting to show the return path makes it unclear if the operation succeeded or failed.
Overloading Messages: Using a single message arrow for multiple distinct actions creates ambiguity.
Redundant Objects: Including objects that do not participate in the specific use case clutters the diagram.
Real-World Application: An Online Order System 💡
Let us apply this knowledge to a practical scenario: An Online Order System. This example demonstrates how to structure a diagram for a typical business process.
Scenario
A customer places an order. The system checks inventory, processes payment, and sends a confirmation.
Participants
Customer: The user initiating the action.OrderForm: The interface capturing input.InventoryManager: The object checking stock.PaymentGateway: The object handling money.OrderDatabase: The object storing the record.
Interaction Flow
1: Customer submits
OrderForm.2:
OrderFormasksInventoryManagerto check stock.3:
InventoryManagerreturns status.4: If stock is available,
OrderFormsends payment request toPaymentGateway.5:
PaymentGatewayconfirms success.6:
OrderFormsaves data toOrderDatabase.7:
OrderDatabasereturns confirmation.
This flow can be mapped onto a Communication Diagram where the OrderForm sits centrally, connected to all other objects. This layout highlights that the form acts as the coordinator for the process.
Integrating Diagrams into the Software Lifecycle 🔄
Communication Diagrams are not just academic exercises. They play a vital role in the software development lifecycle (SDLC).
Analysis Phase: Helps identify missing objects or incorrect relationships early.
Design Phase: Guides the implementation of class structures and method signatures.
Documentation: Serves as a reference for future developers maintaining the code.
Testing: Provides a baseline for writing unit tests that verify interaction logic.
By integrating these diagrams early, engineering teams reduce the cost of fixing design errors later in the process.
Final Thoughts on Modeling 🎯
Creating a Communication Diagram is an exercise in communication itself. It forces you to articulate how your system components relate to one another before a single line of code is written. For undergraduate engineers, mastering this skill bridges the gap between theoretical computer science and practical software engineering.
Remember that the goal is clarity, not complexity. A well-drawn diagram conveys meaning instantly. A poorly drawn one creates confusion. Focus on the structural integrity of your connections and the logical flow of your messages. As you progress in your engineering career, you will find that these diagrams become essential tools for collaboration and system maintenance.
Continue to practice by modeling different systems. Start small, then expand to complex architectures. With consistent effort, you will develop an intuitive sense for system design that will serve you throughout your professional journey.