
Designing software or complex systems requires a clear blueprint. Before writing a single line of code, developers and analysts often need to visualize how users interact with the system. This is where the UML Use Case Diagram becomes essential. It provides a high-level view of the system’s functionality from the perspective of an external observer. However, many beginners struggle with the symbols, relationships, and boundaries involved. This guide breaks down the process into manageable steps.
Whether you are a student, a business analyst, or a developer, understanding how to map out interactions is a critical skill. By following this structured approach, you can create diagrams that communicate intent clearly. We will focus on the core mechanics without relying on specific tools. The principles remain consistent regardless of the drawing medium used.
What Is a Use Case Diagram? 🤔
A Use Case Diagram is a behavioral diagram in the Unified Modeling Language (UML) set. It captures the functional requirements of a system. Unlike a class diagram that focuses on structure, this diagram focuses on behavior. It answers the question: “Who does what with the system?”
It is not about how the system works internally. It is about what the system offers to the outside world. Think of it as a menu in a restaurant. The menu lists the dishes available (use cases) and who can order them (actors). It does not list the recipe (internal logic) or the kitchen layout (architecture).
Key Benefits of This Diagram
- Clarity: It simplifies complex requirements into visual shapes.
- Communication: Stakeholders who are not technical can understand the system flow.
- Scope Definition: It helps define what is inside and outside the system boundary.
- Testing Foundation: Test cases can often be derived directly from use cases.
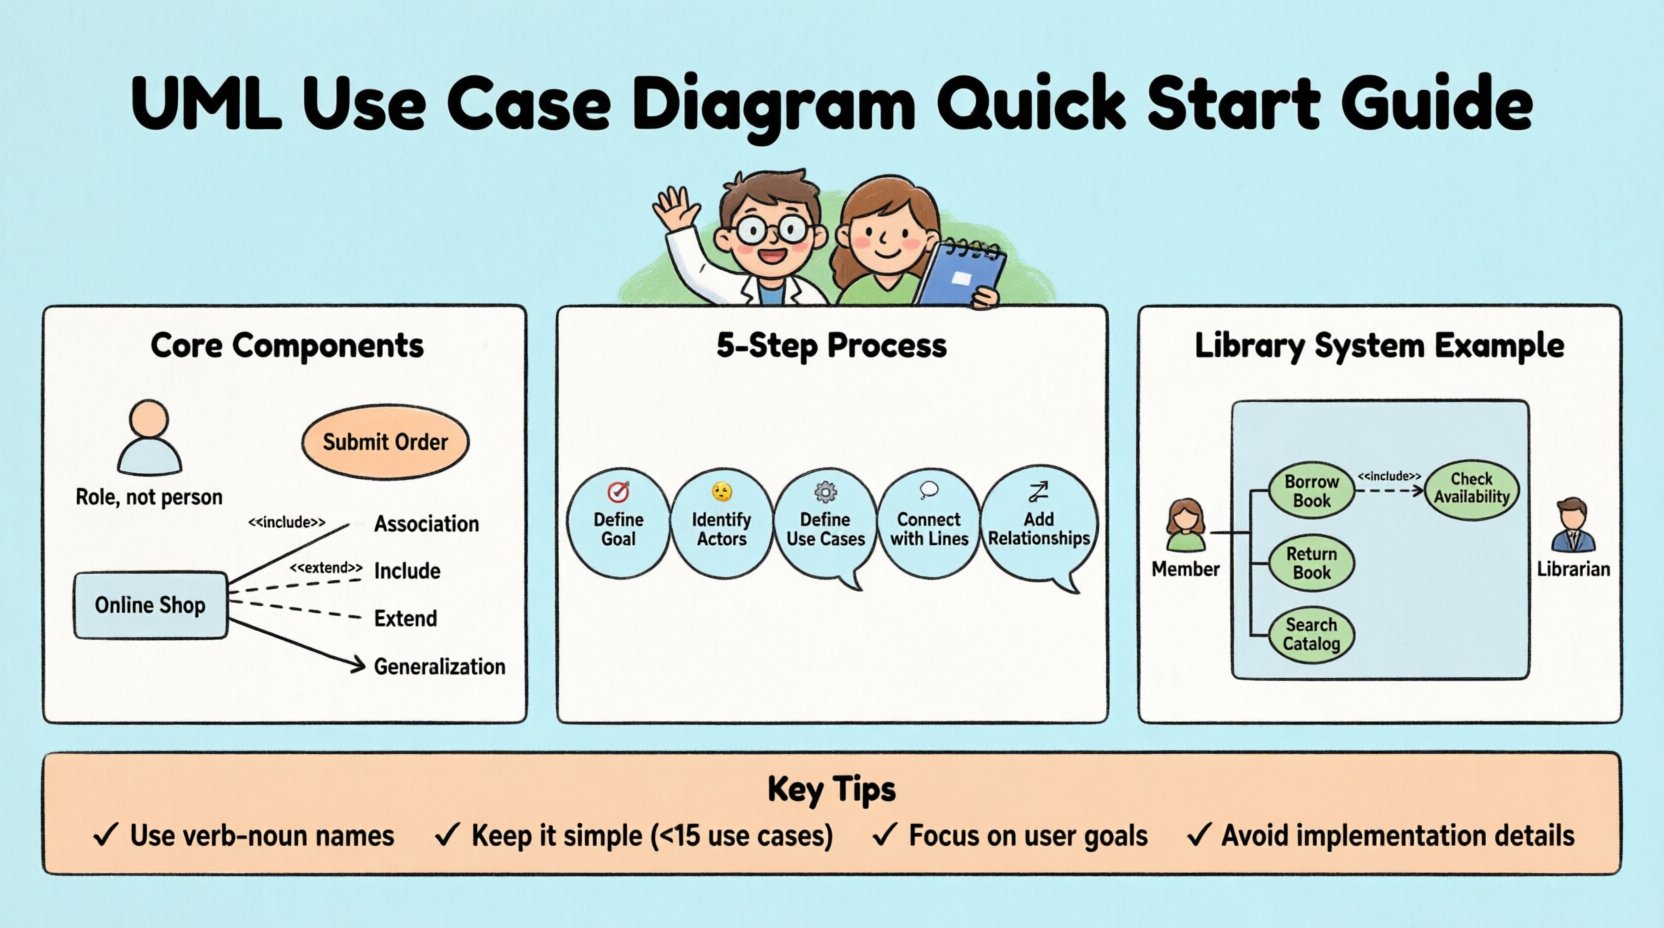
Core Components of a Use Case Diagram 🔑
To create an accurate diagram, you must understand the building blocks. There are four primary elements you will encounter frequently.
1. Actors 👤
An actor represents a role played by a user or an external system. It does not represent a specific person. For example, “Customer” is an actor. “John Smith” is not. If John logs out and Jane logs in, the actor remains “Customer”.
- Human Actors: Users who interact with the system directly (e.g., Administrator, Guest).
- System Actors: External systems or hardware that interact with your system (e.g., Payment Gateway, Weather API).
2. Use Cases ⭕
A use case represents a specific goal or function that the system performs. It is usually depicted as an oval. The text inside the oval describes the action in a verb-noun format.
- Good Example: “Submit Order”
- Bad Example: “Order” (Too vague)
- Bad Example: “Click Button” (Too technical)
3. System Boundary 🟦
The system boundary is a rectangle that encloses all use cases. It clearly separates the system from the actors. Anything inside the box is part of the system. Anything outside is external.
- Label: The box usually has a label at the top (e.g., “Online Shop” or “Library System”).
- Connections: Actors exist outside the box. Lines cross the boundary to connect actors to use cases.
4. Relationships ➡️
Lines connect the elements. Different line styles indicate different types of interactions. Understanding these lines is crucial for accuracy.
| Relationship Type | Symbol | Meaning |
|---|---|---|
| Association | Solid Line | Basic communication between Actor and Use Case. |
| Include | Dashed Line ← < |
One use case must use another use case to complete. |
| Extend | Dashed Line → < |
Optional behavior that may happen under specific conditions. |
| Generalization | Solid Line with Arrowhead | Inheritance. A specialized actor or use case inherits from a parent. |
Step-by-Step Guide to Creating Your Diagram 🛠️
Creating a diagram is a process of discovery. You cannot simply draw it without understanding the requirements first. Follow these five stages to ensure accuracy.
Step 1: Define the System Goal 🎯
Before drawing, write down the primary purpose of the system. Why does this system exist? This helps you determine what belongs inside the system boundary.
- Example: “Manage student enrollments.”
- Example: “Process online credit card transactions.”
If a feature does not support this goal, it likely belongs outside the boundary.
Step 2: Identify the Actors 🧐
Ask yourself: “Who interacts with this system?” List all potential roles. Do not worry about specific names yet.
- Is there an internal user?
- Is there a public user?
- Is there an external database or service?
- Is there a timer or scheduler?
Draw stick figures for these actors on the canvas. Place them outside the system boundary rectangle.
Step 3: Define the Use Cases ⚙️
For each actor, ask: “What can this actor do with the system?” or “What does the system do for this actor?” Write these down as verbs.
- Primary Goal: What is the main reason the actor uses the system?
- Secondary Goal: Are there maintenance tasks or reporting features?
Draw ovals for each use case. Place them inside the system boundary rectangle.
Step 4: Connect Actors to Use Cases 🔗
Draw solid lines between the actors and the use cases they interact with directly. This is the Association relationship.
- If the “Admin” can “Delete User”, draw a line between “Admin” and “Delete User”.
- Ensure the line does not cross other lines unnecessarily to maintain readability.
Step 5: Add Complex Relationships 🔗🔗
Not every interaction is a direct line. Some functions depend on others.
- Include: If “Place Order” always requires “Confirm Payment”, link them with an <
> arrow pointing to the included use case. - Extend: If “Place Order” might optionally require “Apply Discount”, link them with an <
> arrow pointing to the base use case. - Inheritance: If “VIP Customer” is a type of “Customer”, draw a generalization line.
Common Mistakes to Avoid 🚫
Even experienced practitioners make errors. Here are the most frequent pitfalls and how to correct them.
1. Mixing System and Implementation
A common error is including technical steps in the use case. For example, “Click Submit Button” is an implementation detail. The use case should be “Submit Form”. The button is the UI element, the action is the requirement.
2. Too Many Use Cases
If a diagram has 50 ovals, it is too complex. Use Case Diagrams are meant for high-level overviews. If you have too many details, split the system into subsystems or move details to a Use Case Specification document.
3. Vague Names
Avoid names like “Process” or “Do Something”. Use specific action words. “Calculate Tax” is better than “Process Data”.
4. Incorrect Relationship Directions
The direction of the arrow matters. In an <
Detailed Examples of Scenarios 📝
To solidify understanding, let us look at two distinct scenarios. These examples demonstrate how to apply the rules in practice.
Scenario A: Library Management System 📚
In this system, users borrow books, and staff manage inventory.
- Actors: Member, Librarian, System (for overdue notifications).
- Use Cases: Borrow Book, Return Book, Search Catalog, Renew Loan.
- Relationships:
- Member associates with Borrow Book.
- Librarian associates with Search Catalog.
- Borrow Book <
> Check Availability. - Borrow Book <
> Notify Overdue (if overdue policy is active).
Scenario B: Online Voting System 🗳️
A secure system for casting digital votes.
- Actors: Voter, Election Commission, Authentication Server.
- Use Cases: Login, Cast Vote, Verify Eligibility, Tally Results.
- Relationships:
- Voter associates with Cast Vote.
- Cast Vote <
> Verify Eligibility. - Verify Eligibility <
> Check Authentication Server. - Election Commission associates with Tally Results.
Best Practices for Clean Diagrams 🎨
A diagram that is hard to read defeats its purpose. Follow these guidelines to ensure professional quality.
Layout and Spacing
- Group related use cases together.
- Keep actor names consistent (use the same label throughout).
- Avoid crossing lines where possible. If they must cross, use a bridge symbol or route the line around.
Labeling Conventions
- Always label the lines if the relationship is not obvious.
- Use <
> like < > or < > on the dashed lines. - Keep text legible and centered within shapes.
Version Control
Requirements change. Your diagram should reflect that. When updating a diagram:
- Note the date of the revision.
- Document why a use case was removed or added.
- Ensure all team members are looking at the latest version.
Integration with Other Diagrams 🔗
A Use Case Diagram is rarely a standalone document. It works best as part of a larger UML suite.
With Sequence Diagrams
Once you have identified a use case, you can create a Sequence Diagram to show the step-by-step message flow between objects. The Use Case is the trigger; the Sequence Diagram is the detailed interaction.
With Class Diagrams
Use cases often drive the creation of classes. If a use case is “Calculate Interest”, there is likely a “Loan” class involved. The Use Case Diagram helps identify the scope of classes needed.
With State Machine Diagrams
If a use case involves complex state changes (e.g., “Order Status”), a State Machine Diagram can complement the Use Case to show the lifecycle of an object.
Handling Edge Cases and Exceptions ⚠️
Systems often fail or behave unexpectedly. A robust diagram accounts for these scenarios without cluttering the main flow.
- Use <
> for Errors: If a “Login” use case fails due to “Wrong Password”, you can model this as an extension. However, keep it simple. Do not model every single error message. - Focus on Happy Path: Prioritize the successful flow first. Add exceptions later if they require significant system behavior changes.
- Alternative Flows: Document these in text specifications rather than on the diagram itself to keep the visual clean.
Maintaining the Diagram Over Time 🔄
Software evolves. A diagram created at the start of a project may become obsolete if requirements shift. Here is how to maintain it.
- Review During Sprints: Check if new features require new use cases.
- Remove Obsolete Features: If a function is deprecated, remove the use case oval.
- Update Actors: If a new role is added to the organization, add the actor to the diagram.
- Consistency Check: Ensure the diagram matches the current codebase logic.
Frequently Asked Questions ❓
Can I use a Use Case Diagram for non-software projects?
Yes. While most common in software, it applies to any system with inputs and outputs. For example, a manufacturing process or a customer service workflow.
How many use cases is too many?
There is no strict number, but if the diagram requires zooming out to see the whole picture, it is likely too crowded. Aim for fewer than 10-15 use cases per diagram for clarity.
Do I need to show every single button click?
No. Use Case Diagrams are at the user goal level. Button clicks are part of the user interface design, which is a lower level of abstraction.
What if the system has no human actors?
It is possible. The system might interact with other systems or sensors. In this case, the external system is the actor. For example, a “Sensor Data Logger” system might have “Weather Station” as an actor.
Summary of Key Takeaways 📌
- Start with Goals: Know what the system does before drawing.
- Use Standard Symbols: Stick to the UML conventions for Actors (Stick Figure), Use Cases (Oval), and Boundaries (Rectangle).
- Clear Relationships: Distinguish between Association, Include, Extend, and Generalization.
- Keep it Simple: Avoid implementation details and focus on user value.
- Iterate: Treat the diagram as a living document that evolves with the project.
By adhering to these guidelines, you will produce diagrams that serve as effective communication tools. They bridge the gap between business needs and technical implementation. With practice, creating these diagrams will become a natural part of your design workflow. Focus on clarity and accuracy above all else.