
In modern software architecture, the complexity of interactions between services often outpaces the clarity of their documentation. A sequence diagram serves as a critical tool for visualizing the dynamic behavior of a system over time. It captures the flow of messages between participants, revealing how data moves, how services interact, and where potential bottlenecks or failure points exist. When applied rigorously to distributed systems and API development, these diagrams transform abstract logic into actionable architectural blueprints.
This guide outlines the essential standards for creating effective sequence diagrams. It focuses on clarity, accuracy, and maintainability without relying on specific tools or proprietary software. By adhering to these practices, engineering teams can ensure their documentation remains a reliable source of truth throughout the development lifecycle.
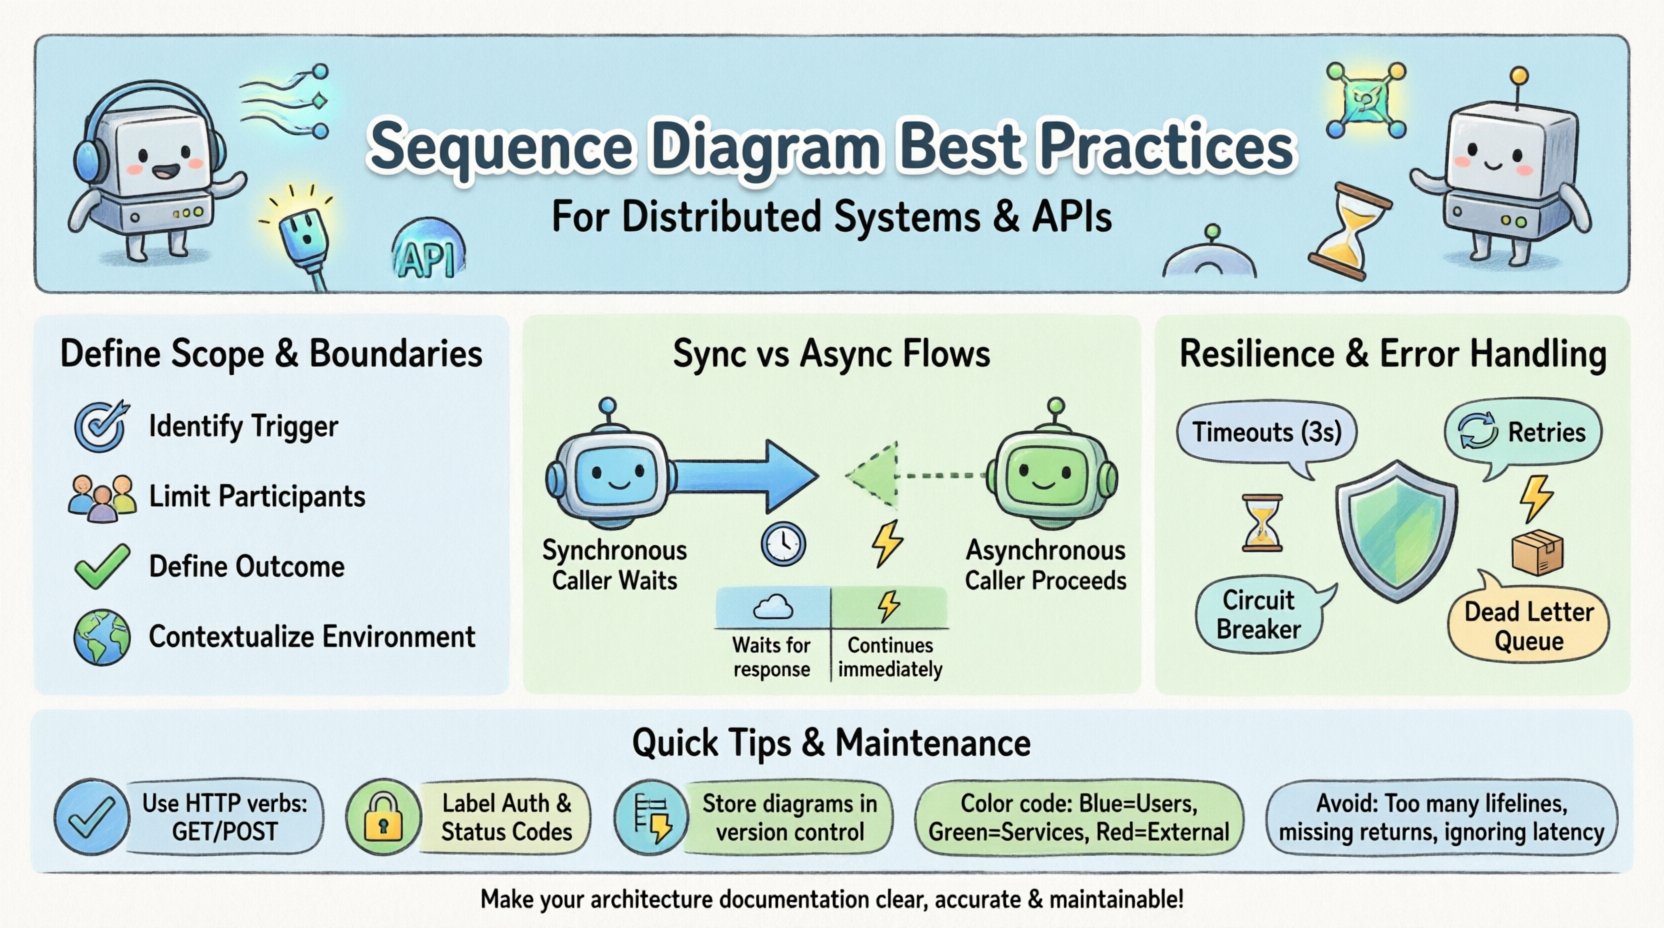
🎯 Defining Scope and Boundaries
A sequence diagram is not a general overview of the entire system. It is a focused narrative describing a specific scenario. Attempting to map every possible interaction in a single diagram leads to clutter and confusion. To maintain utility, you must establish clear boundaries for each diagram.
- Identify the Trigger: Every diagram should start with a specific event or user action. This could be an HTTP request, a scheduled job, or an external webhook.
- Limit the Participants: Restrict the number of lifelines. If a diagram requires more than six or seven distinct actors, consider splitting it into logical sub-processes.
- Define the Outcome: Clearly mark the end state. Does the transaction complete successfully? Does it result in a timeout? Does it trigger a background process?
- Contextualize the Environment: Indicate the environment (e.g., Production, Staging) if behavior differs significantly between them.
By narrowing the scope, you ensure that stakeholders can quickly grasp the specific flow without wading through unrelated system behaviors.
🔄 Visualizing Synchronous vs Asynchronous Flows
Distributed systems rely heavily on both synchronous and asynchronous communication patterns. Confusing these two in a diagram can lead to implementation errors and performance issues. Understanding the visual distinction is paramount.
Synchronous Communication
Synchronous calls imply that the sender waits for a response before proceeding. In a sequence diagram, this is represented by a solid line with a solid arrowhead.
- Use Case: Real-time data retrieval, immediate API validation, or transactional updates.
- Visual Cue: The lifeline of the sender shows an activation bar while waiting for the reply.
- Implication: High latency in one service blocks the entire chain. This must be highlighted in the diagram to warn architects about potential cascading delays.
Asynchronous Communication
Asynchronous calls allow the sender to continue processing immediately after sending a message. This is crucial for decoupling services.
- Use Case: Event publishing, background task queuing, or notification delivery.
- Visual Cue: Use a dashed line with an open arrowhead for the request. Use a return arrow if a response is expected later.
- Implication: The sender does not hold a connection open. The diagram should show the timeline continuing on the sender’s lifeline while the receiver processes the event.
| Feature | Synchronous | Asynchronous |
|---|---|---|
| Arrow Style | Solid Line, Closed Arrow | Dashed Line, Open Arrow |
| Waiting State | Caller waits (Active) | Caller proceeds (Idle) |
| Failure Impact | Immediate Error | Eventual Consistency |
| Common Protocol | HTTP/HTTPS | Message Queues, Webhooks |
📡 API Contract Visualization Standards
API development requires precise documentation of what data is sent and what is returned. A sequence diagram should reflect the API contract, ensuring developers and consumers are aligned.
- Message Naming: Use the HTTP verb or method name. For example, use
GET /usersorPOST /ordersrather than generic labels likeGet Data. - Headers and Body: If critical headers (like
AuthorizationorContent-Type) affect the flow, note them on the message line. - Status Codes: Explicitly label return messages with status codes (e.g.,
200 OK,401 Unauthorized,500 Internal Server Error). - Data Shapes: For complex payloads, do not list every field. Instead, reference the data model or schema definition (e.g.,
UserObject) to keep the diagram readable. - Idempotency: If a request is idempotent, indicate this in the notes. This informs the consumer that retrying the request is safe.
When documenting internal service-to-service communication, be explicit about authentication mechanisms. Whether it involves mutual TLS, API keys, or bearer tokens, the diagram should indicate where this security layer sits.
🛡️ Resilience and Error Handling
Happy paths are easy to document, but the value of a sequence diagram lies in showing how the system behaves when things go wrong. In distributed systems, failure is a certainty, not an exception.
- Timeouts: Draw a dashed line indicating a timeout event. Specify the duration if it is a configurable constant (e.g.,
3s Timeout). - Retries: Use combined fragments (like
altoropt) to show retry logic. Indicate the maximum number of retries allowed. - Circuit Breakers: If a service fails repeatedly, show the state transition where the circuit breaker opens, preventing further calls to the failing service.
- Compensation: For transactions spanning multiple services, show the rollback or compensation flow if a downstream step fails.
- Dead Letter Queues: If messages are sent asynchronously and fail processing, indicate where the message is routed for later inspection.
By visualizing failure, you force the team to consider edge cases during the design phase rather than discovering them during production incidents.
🔄 Maintenance and Versioning
A sequence diagram that is not maintained becomes technical debt. It misleads developers and creates a disconnect between the code and the documentation. A robust strategy for keeping diagrams current is essential.
- Version Control: Store diagrams alongside the codebase in the same repository. This ensures that any change to the API triggers a review of the diagram.
- Code Review Integration: Treat diagram updates as part of the pull request process. If a new endpoint is added, the diagram must be updated before merging.
- Automated Generation: Where possible, use tools to generate diagrams from code or API specifications (like OpenAPI/Swagger). This reduces the manual effort required to keep them accurate.
- Deprecation Notices: If an endpoint is being deprecated, mark it clearly in the diagram with a strikethrough or a specific note. This prevents new integrations from relying on old logic.
- Ownership: Assign ownership of specific diagram sections to specific teams. This clarifies who is responsible for updating the documentation when their service changes.
⚠️ Common Pitfalls to Avoid
Even experienced engineers make mistakes when creating sequence diagrams. Awareness of common errors helps maintain high quality.
- Overloading Lifelines: Do not place too much logic on a single lifeline. If a service performs complex internal logic, consider a nested diagram or a class diagram instead.
- Ignoring Time: Sequence diagrams represent time flowing downwards. Do not draw backward arrows or loops that violate the temporal flow without clear explanation.
- Missing Return Messages: While optional in some notations, omitting return messages can make it unclear how the caller knows the operation succeeded.
- Ignoring Latency: In distributed systems, network latency matters. If a call takes 500ms, a 50ms call, or 5s, note this. It affects the visual spacing and the understanding of system responsiveness.
- Too Much Detail: Do not diagram the internal logic of a service unless it is relevant to the interaction. Focus on the boundaries and the data crossing them.
🔗 Handling References and Cross-Cutting Concerns
Complex systems often share common concerns across multiple diagrams. How you handle these references impacts the readability of the entire documentation suite.
Authentication and Authorization
Every request typically requires authentication. You do not need to draw the login flow for every single API call. Instead, establish a convention:
- Global Note: Place a note at the top of the diagram stating that all requests require a valid JWT token.
- Specific Fragments: Use an
optfragment specifically for the authentication check if the flow branches based on permission levels.
Logging and Auditing
Every interaction should ideally be logged. While you do not need to show a message to a log file for every single step, you should indicate where audit trails are created.
- Key Events: Highlight state changes that require auditing (e.g.,
Order Status Changed). - Security Logs: Indicate where security events (login failures, permission denied) are recorded.
📝 Summary of Implementation Steps
To integrate these practices into your workflow, follow this structured approach.
- Define the Use Case: Write a one-sentence description of the scenario being modeled.
- Identify Actors: List all external systems, users, and internal services involved.
- Map the Happy Path: Draw the successful flow first. Ensure all return messages are accounted for.
- Map the Exception Path: Add error handling, timeouts, and retries.
- Review for Clarity: Check if the diagram can be understood by someone who did not write it.
- Validate Against Code: Ensure the diagram matches the actual implementation logic.
🎨 Visual Consistency and Styling
Consistency in visual style reduces cognitive load. When a team member opens a new diagram, they should immediately recognize the conventions.
- Color Coding: Use consistent colors for different types of actors (e.g., Blue for Users, Green for Internal Services, Red for External APIs).
- Font Sizes: Keep message labels readable. Use bold text for critical parameters.
- Alignment: Align the lifelines vertically. Do not stagger them arbitrarily.
- Spacing: Ensure there is enough vertical space between message lines to avoid visual crowding.
Adopting these visual standards ensures that the documentation remains professional and accessible to all team members, regardless of their specific role.
🚀 Conclusion
Creating high-quality sequence diagrams requires discipline and attention to detail. It is not merely about drawing boxes and arrows; it is about modeling the behavior of your system accurately. By adhering to these best practices, you create a living documentation artifact that supports development, testing, and maintenance. This clarity reduces risk, speeds up onboarding for new engineers, and ensures that your distributed systems remain robust and understandable over time.