
Understanding how software components interact is a cornerstone of effective system design. Sequence diagrams provide a visual representation of these interactions over time. For new developers, grasping the specific symbols used in these diagrams is essential for communicating architecture, debugging flows, and documenting logic. This guide covers every essential symbol, ensuring you can read and create sequence diagrams with precision.
🔍 What Is a Sequence Diagram?
A sequence diagram is a type of interaction diagram in the Unified Modeling Language (UML). It shows how objects or parts of a system interact with each other to complete a task. Unlike class diagrams which show structure, sequence diagrams focus on behavior and the timeline of events.
- Time flows vertically: Actions at the top happen before actions at the bottom.
- Participants interact horizontally: Messages are sent from one participant to another.
- Focus on order: The sequence of calls is critical for understanding logic.
By mastering the symbols, you can translate complex code logic into a clear visual narrative. This helps teams identify bottlenecks, race conditions, or unnecessary dependencies before writing a single line of code.
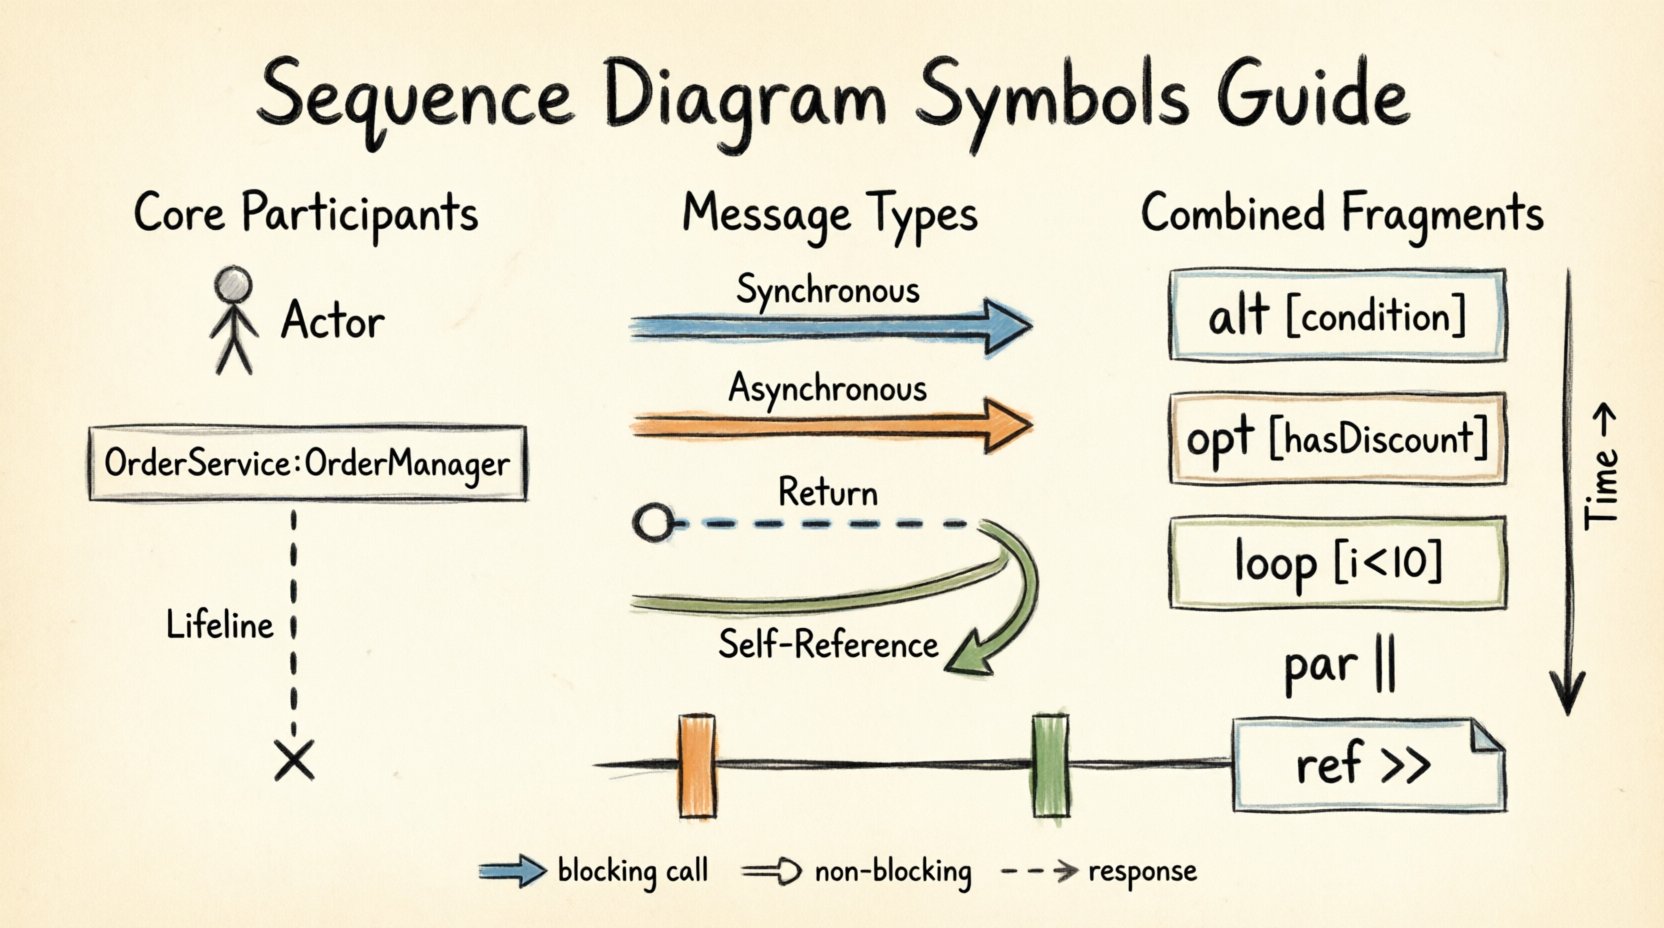
🏗️ Core Participants and Lifelines
The foundation of any sequence diagram is the participant. These represent the actors or objects involved in the interaction.
👤 Actors
Actors represent external entities that interact with the system. They are typically human users, but can also be external services or hardware devices.
- Symbol: A stick figure icon.
- Placement: Usually located at the far left or far right of the diagram.
- Role: Initiates a request or receives a response.
📦 Objects and Instances
Objects represent specific instances of a class within the system. They are the active components processing data.
- Symbol: A rectangle with the object name and class type (e.g.,
OrderService:OrderManager). - Placement: Arranged horizontally across the top of the diagram.
- Role: Receives messages and performs operations.
📏 Lifelines
A lifeline is a vertical dashed line extending downward from a participant. It represents the existence of that participant over time.
- Symbol: A vertical dashed line.
- Meaning: The participant is “alive” or active during this period.
- Usage: All messages and interactions must connect to a lifeline.
💀 Destruction
Not all objects exist for the entire duration of the interaction. Some are created temporarily and destroyed once their task is complete.
- Symbol: A small cross (X) at the end of a lifeline.
- Meaning: The object is removed from memory or the active scope.
- Timing: Appears after the last message received by that object.
📨 Message Types and Communication
Messages are the arrows connecting lifelines. They represent the communication between objects. The arrow style indicates the type of interaction.
🔄 Synchronous Messages
This is the most common interaction type. The sender waits for a response before continuing execution.
- Symbol: A solid line with a filled arrowhead.
- Behavior: Blocking call. The caller pauses until the callee returns.
- Example: A user clicking “Save” and waiting for the confirmation dialog.
⚡ Asynchronous Messages
The sender does not wait for the response. It fires the message and continues its own process immediately.
- Symbol: A solid line with an open arrowhead.
- Behavior: Non-blocking call. The caller proceeds without waiting.
- Example: Sending a log message to a server while the user continues browsing.
🔙 Return Messages
After a message is processed, the response flows back to the sender.
- Symbol: A dashed line with an open arrowhead.
- Direction: Points back to the original sender.
- Usage: Indicates data return or completion status.
🔄 Self-Referencing Messages
Sometimes an object needs to call a method on itself.
- Symbol: An arrow that loops back to the same lifeline.
- Usage: Internal processing, recursion, or state updates.
🏁 Activation Bars
Activation bars indicate when an object is actively performing an operation. They appear on the lifeline as a thin rectangle.
- Symbol: A narrow vertical rectangle on the lifeline.
- Start: Begins when a message is received.
- End: Ends when the message processing is complete or a return message is sent.
- Importance: Shows when the system is busy processing a specific task.
🔲 Combined Fragments
Combined fragments allow you to show complex logic like loops, conditionals, and parallel processing within a sequence diagram. They are enclosed in a frame.
📑 Alt (Alternative)
Used for if-else logic. Only one of the enclosed sections will execute.
- Symbol: A frame labeled
altwith internal horizontal bars separating sections. - Labels: Conditions are written in square brackets (e.g.,
[user is logged in]). - Usage: Handling different user states or error conditions.
🔍 Opt (Optional)
Similar to alt, but the entire block is optional. It may not happen at all.
- Symbol: A frame labeled
opt. - Condition: Usually a single boolean condition (e.g.,
[has discount]). - Usage: Showing features that are enabled only under specific configurations.
🔄 Loop
Represents a repetitive process. The enclosed actions happen multiple times.
- Symbol: A frame labeled
loop. - Condition: Can specify iteration count (e.g.,
[i < 10]) or just*for indefinite loops. - Usage: Processing lists, iterating through database rows, or polling.
✂️ Break
Used to show a condition that terminates a loop or flow early.
- Symbol: A frame labeled
break. - Usage: Exiting a search loop when a result is found.
📡 Par (Parallel)
Indicates that multiple operations happen at the same time.
- Symbol: A frame labeled
parwith internal horizontal bars. - Usage: Concurrent API calls, background tasks, or multi-threading scenarios.
📎 Ref (Reference)
Used to include a reference to another sequence diagram. This helps avoid cluttering a single diagram with too much detail.
- Symbol: A frame labeled
ref. - Usage: Linking to a detailed sub-process diagram.
📝 Notes and Annotations
Notes provide context, comments, or constraints that do not fit into the standard flow.
- Symbol: A rectangle with a folded corner, connected to a lifeline or frame.
- Content: Text explaining a constraint, a warning, or a design decision.
- Placement: Attached to the relevant lifeline or fragment.
📋 Quick Reference Table
| Symbol Name | Visual Representation | Meaning | Common Use Case |
|---|---|---|---|
| Actor | Stick Figure | External Entity | User initiating action |
| Lifeline | Dashed Vertical Line | Existence over Time | Object scope |
| Synchronous Message | Filled Arrow | Blocking Call | Wait for response |
| Asynchronous Message | Open Arrow | Non-Blocking Call | Fire and forget |
| Return Message | Dashed Open Arrow | Response | Data return |
| Activation Bar | Vertical Rectangle | Processing Active | Task execution time |
| Alt Frame | Box with [cond] | Conditional Logic | If/Else blocks |
| Loop Frame | Box with * or count | Iteration | For loops |
| Par Frame | Box with parallel bars | Concurrency | Parallel tasks |
🧩 Best Practices for Diagramming
Creating clear sequence diagrams requires discipline. Following established conventions ensures that anyone reading the diagram understands the system flow without confusion.
- Keep it Linear: Avoid crossing lines where possible. Use
parorrefto manage complexity. - Be Specific: Name methods clearly. Use verbs for actions (e.g.,
validateUser()instead ofcheck). - Limit Scope: Do not try to diagram the entire application in one image. Focus on specific use cases or flows.
- Use Frames Wisely: Don't overuse
altorloopif the logic is simple. Direct messages are often clearer. - Consistency: Stick to one style for arrows and boxes throughout the documentation.
🚧 Common Pitfalls to Avoid
New developers often make specific mistakes when first creating these diagrams. Recognizing these errors early improves the quality of your documentation.
- Mixing Logic and Flow: Do not put implementation details (like variable assignments) inside the message label. Keep labels to the action name.
- Ignoring Return Messages: Forgetting the dashed return arrow makes it unclear if the operation succeeded or failed.
- Overcrowding: Too many participants make the diagram hard to read. Group related objects or use
refto abstract them. - Unclear Conditions: In
altframes, ensure the conditions cover all logical possibilities (e.g., true and false). - Wrong Arrow Types: Using a synchronous arrow for an asynchronous task misrepresents the system's performance characteristics.
🛠️ Reading a Diagram Step-by-Step
When analyzing an existing sequence diagram, follow this process to understand the system behavior accurately.
- 1. Identify Participants: Look at the top. Who is involved? Is it a user, a database, or an external API?
- 2. Trace the Lifelines: Follow the vertical lines. Notice where activation bars appear. This shows which object is doing the work.
- 3. Follow the Arrows: Move from top to bottom. Observe the direction of messages. Who calls whom?
- 4. Check the Frames: Look for
alt,loop, orpar. Understand the branching logic. - 5. Verify Returns: Ensure every request has a corresponding return path to confirm the flow completes.
🔗 Integrating with Code
Sequence diagrams are not just documentation; they are design tools. They should align closely with the actual code implementation.
- Code Review: Use diagrams to review pull requests. Does the new code match the intended flow shown in the diagram?
- Architecture Design: Draft the diagram before coding. This reveals missing error handling or edge cases.
- Onboarding: New team members can read the diagram to understand the system faster than reading raw code.
- Refactoring: If a diagram is hard to draw, the code might be too complex. Simplify the design.
🧠 Understanding Time and Concurrency
Time is the most critical dimension in a sequence diagram. It is strictly vertical. This implies causality.
- Causal Order: If Message A is above Message B on the same lifeline, A happened first.
- Parallelism: If Message X and Message Y start at the same vertical level on different lifelines, they are happening concurrently.
- Asynchrony: Asynchronous messages allow the sender to move down the timeline before the receiver processes the message.
📝 Conclusion on Notation
Sequence diagrams are a powerful tool for visualizing system interactions. By adhering to the standard symbols and conventions, you ensure clarity and communication across your team. Whether you are planning a new feature or debugging a complex flow, these symbols provide the vocabulary needed to describe software behavior accurately.
Focus on precision in your notation. Use the correct arrow types, clearly define your participants, and utilize frames to manage complexity. Over time, creating and reading these diagrams will become second nature, serving as a bridge between abstract logic and concrete implementation.