
Microservices architectures introduce complexity that single applications rarely face. The promise of independence and scalability often collides with the reality of distributed failure. When a request traverses multiple services, the path is rarely a straight line from client to database. It is a journey through networks, queues, and various logical boundaries. In this environment, visualizing the happy path is insufficient. Teams must understand how the system behaves when things go wrong.
Sequence diagrams are the standard for mapping these interactions. They show time as a vertical axis and participants as horizontal lines. However, standard notation often focuses on success. To build resilient systems, you must explicitly model failure. This guide explores how to handle errors and exceptions visually in microservices without relying on specific tools. The goal is clarity, maintainability, and shared understanding.
Why Error Paths Matter More Than Happy Paths 🛑
Most documentation prioritizes the successful flow. Users expect data to arrive, processes to complete, and responses to be returned. This creates a false sense of security. In production, networks saturate, services crash, and data locks occur. If your diagrams do not reflect these realities, your team cannot prepare.
Visualizing errors serves several critical functions:
- Expectation Management: Developers see that failures are expected, not anomalies.
- Design Validation: Architects can spot missing retry logic or timeout configurations.
- Incident Response: Engineers can reference the diagram during outages to trace the failure point.
- Onboarding: New team members learn the system’s fragility from day one.
When you draw a sequence diagram, you are telling a story. If the story only has a good ending, the audience will be unprepared for the rest of the narrative.
Standardizing Failure Notation 📐
Without a shared convention, diagrams become personal art projects. One developer might use a dashed line for errors, while another uses a red color. Consistency is key for quick comprehension. You should establish a visual grammar for exceptions that applies across all microservice interactions.
Consider adopting the following conventions:
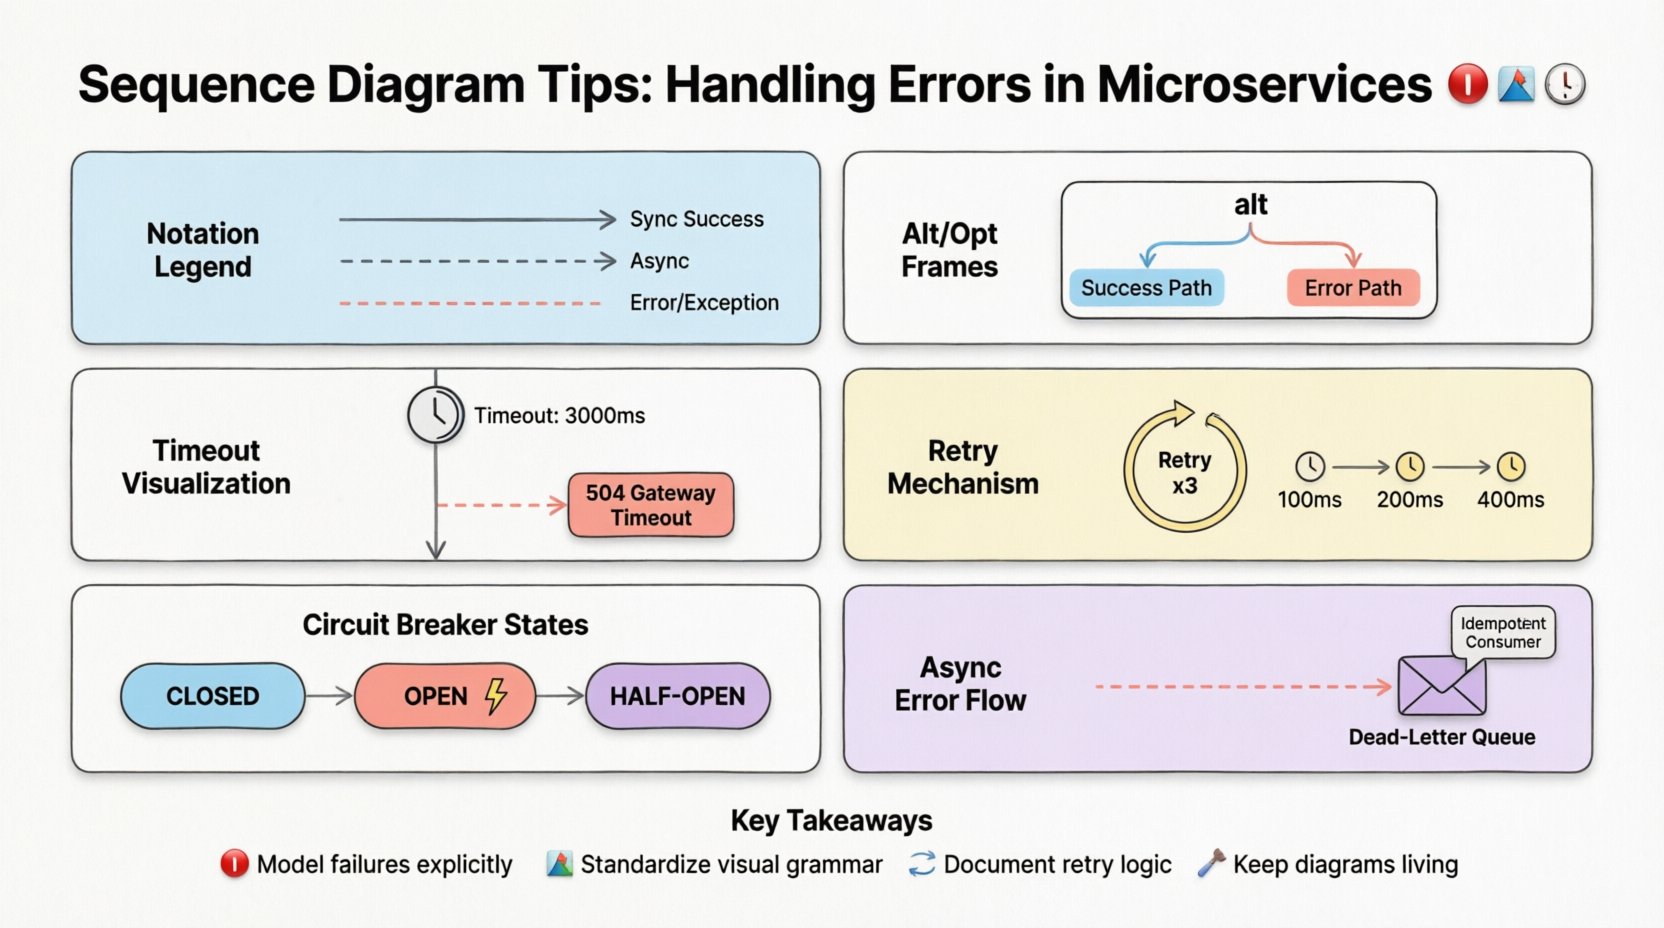
- Solid Lines: Successful synchronous requests.
- Dashed Lines: Successful asynchronous responses or notifications.
- Dashed Red Lines (or distinct style): Error responses or exceptions.
- Alt/Opt Frames: Conditional logic blocks for handling different outcomes.
Using frames like alt or opt helps structure the diagram logically. It separates the normal flow from the exceptional flow. This makes it easier to read the “what happens if” scenarios without cluttering the primary success path.
Visualizing Timeout Scenarios ⏳
Timeouts are a common source of confusion in distributed systems. When a service does not respond within a specific window, the caller must decide what to do. Is it a transient network glitch? Is the service down? Is the database locked?
Visualize this by explicitly labeling the timeout threshold. Show the interaction line extending to a specific point, then branching into an error handling path. Label the branch with the action taken.
| Label | Meaning | Action |
|---|---|---|
| Timeout: 3000ms | Caller waits 3 seconds | Return Error Code 504 |
| Retry: 3 Attempts | Caller retries the request | Wait 100ms, then retry |
| Circuit Breaker | Fail fast after 5 failures | Short-circuit to fallback |
This table structure helps teams align on their expectations. It moves the discussion from “we should handle timeouts” to “we handle timeouts at 3 seconds with 3 retries”.
Cascading Failures and Fault Propagation 🌊
One of the greatest risks in microservices is the cascade. If Service A waits for Service B, and Service B waits for Service C, a delay in C can exhaust resources in A. Visualizing this chain reaction is vital.
Use vertical stacking to show depth. If Service A calls B, and B calls C, ensure the lines are aligned vertically to show the blocking nature of the call. If the call is asynchronous, use a return message later in the timeline to show the non-blocking nature.
Highlight the resource consumption during a failure. If Service A keeps retrying Service B, it consumes threads and memory. You can annotate the lifeline of Service A with a note indicating resource usage spikes during the error loop.
Consider these patterns for preventing cascades:
- Batching: Group requests to reduce load.
- Rate Limiting: Restrict the number of requests per second.
- Timeouts: Ensure no single request holds a resource forever.
- Fallbacks: Return partial data or cached data when the dependency fails.
Visualizing Retry Mechanisms 🔄
Retries are standard practice for transient errors. However, uncontrolled retries can cause thundering herd problems. If every instance of Service A retries Service B simultaneously upon failure, Service B might crash under the load.
In your diagram, represent retries using a loop frame or a repeated message arrow. Crucially, annotate the delay between retries. Exponential backoff is a common strategy where the wait time increases with each attempt.
Include the logic for when to stop retrying. Is it a fixed number of attempts? Is it time-based? Is it based on the error type? Distinguish between client-side retries and server-side retries. Client retries happen at the caller. Server retries happen at the receiver if a request fails internally.
Circuit Breaker Patterns in Flow 🛡️
A circuit breaker prevents a service from repeatedly attempting an operation on an endpoint that is currently unavailable. It acts like an electrical fuse. When the failure rate exceeds a threshold, the circuit trips, and subsequent calls fail immediately without hitting the failing service.
Visualizing this requires showing the state of the circuit breaker. You can use a frame labeled Breaker State to show the transition from Close (normal operation) to Open (failing fast) to Half-Open (testing recovery).
This visualization helps developers understand why a request might fail instantly without waiting for a timeout. It clarifies the behavior during degraded service conditions.
Timeout Thresholds and Deadlines ⏱️
Timeouts define the contract between services. If Service A expects a response within 100ms, it should not wait indefinitely. Define these thresholds clearly in the diagram.
Use notes or annotations on the interaction line to specify the deadline. For example: “Wait max 500ms for response”. This informs the implementation of the client code. It ensures that the caller does not hang, which could block thread pools.
Asynchronous Error Handling 📬
Not all interactions are synchronous. Some systems rely on events and messages. When an error occurs in an asynchronous flow, the sender might not know immediately. The receiver might log the error, or it might trigger a compensation transaction.
Use dashed lines for asynchronous messages. Show the error message traveling back to the sender or to a dead-letter queue. If the system supports idempotency, note that the consumer can safely retry the message without duplicating data.
Consider the following scenarios:
- Message Loss: What happens if the message never arrives?
- Processing Failure: What happens if the consumer crashes while processing?
- Reordering: What happens if messages arrive out of order?
Addressing these in the diagram forces the team to design for them. It moves error handling from an afterthought to a core requirement.
Keeping Diagrams Maintainable 🛠️
A sequence diagram that is accurate today will be wrong tomorrow if the code changes. Maintenance is often neglected. Treat diagrams as living documents.
Follow these rules to keep them useful:
- One Diagram Per Scenario: Do not cram all logic into one massive chart. Break them down by use case.
- Abstract Complexity: Do not show every internal method call. Focus on service-to-service interactions.
- Version Control: Store diagrams alongside the code. If the API changes, the diagram should change in the same commit.
- Review Process: Include diagrams in code reviews. If the code implements error handling differently than the diagram, update the diagram.
Common Pitfalls to Avoid ⚠️
Even with good intentions, diagrams can become misleading. Be wary of these common mistakes:
- Ignoring Latency: Drawing lines that are too short makes the system look faster than it is.
- Missing Return Paths: Showing a request but not the response creates confusion about who owns the failure.
- Overloading Frames: Using too many nested
altframes makes the diagram unreadable. - Ignoring Data Types: Not specifying if an error returns a specific error code or a generic message.
- Assuming Synchronous: Treating async calls as sync in the diagram.
Integrating with Incident Post-Mortems 📝
When an incident occurs, teams often produce post-mortems. These documents explain what went wrong. Sequence diagrams can bridge the gap between the post-mortem and the design.
If a timeout caused an outage, update the diagram to show the new threshold. If a retry loop caused a cascade, update the diagram to show the new limit. This creates a feedback loop where operational experience improves design documentation.
Collaboration and Shared Understanding 🤝
Diagrams are communication tools. They are not just for developers. Product managers, QA engineers, and stakeholders benefit from seeing the failure paths.
When a product manager understands that a feature relies on a third-party API that might timeout, they can plan for graceful degradation. They can set expectations with users that the system might be slower during peak load.
Use diagrams in planning meetings. Walk through the error path to ensure everyone agrees on the behavior. This reduces surprises during launch.
Tooling Agnostic Best Practices 🧰
While various tools exist for drawing diagrams, the principles remain the same. Focus on the content, not the editor.
- Text-Based Descriptions: If you use a text-based format, ensure the syntax is clear.
- Image Export: If you use a GUI, ensure the export is high resolution for documentation.
- Linking: Link diagrams to the relevant code repositories.
- Searchability: Ensure the file names and metadata allow easy searching.
Summary of Key Takeaways ✅
Handling errors in microservices requires intention. You cannot rely on the network to be perfect. You must design for failure.
Sequence diagrams are the best tool to communicate this design. They show the flow of requests and the branching paths of exceptions. By standardizing notation, visualizing timeouts, and documenting retry logic, you create a map of the system’s resilience.
Remember that diagrams are part of the code. They must be updated when the system changes. They must be reviewed by the team. They must be readable by humans, not just machines.
When you invest time in these visualizations, you invest in stability. You reduce the cognitive load during incidents. You make the system’s behavior predictable. That is the value of a well-drawn sequence diagram.
Start by auditing your current diagrams. Do they show the error paths? If not, add them. Do they show the timeouts? If not, specify them. Do they show the retries? If not, define the limits. Small changes in documentation lead to large improvements in reliability.
Keep the diagrams simple. Keep them accurate. Keep them alive. This is how you build systems that withstand the inevitable chaos of distributed computing.
Final Thoughts on Visual Communication 💬
Technical writing and diagramming are acts of empathy. You are creating artifacts for future readers. Those readers might be you, six months from now, or a new hire, six months from today.
Make it easy for them. Make the failure paths as clear as the success paths. When they read your diagram, they should feel confident that they understand how the system handles adversity. This confidence translates to better operational decisions and faster recovery times.
There is no magic tool that solves this. There is only the discipline of documentation. Treat your diagrams with the same rigor as your code. Review them, test them, and update them. This discipline is what separates fragile systems from robust ones.